


INTRODUCTION
Tobacco use remains the leading preventable cause of death worldwide, and the great majority of that burden is carried by adults who took up smoking years or decades earlier1. Globally, tobacco use has fallen substantially over the past two decades, from an estimated 1.38 billion users in 2000 to 1.20 billion in 2024, yet roughly one in five adults worldwide still uses tobacco, and progress remains strikingly uneven: the WHO European Region now carries the highest regional prevalence of tobacco use in the world, while the African Region, from a much lower starting point, is one of only two WHO regions currently on track to meet the global 30% relative-reduction target2. The World Health Organization’s STEPwise approach to noncommunicable disease risk factor surveillance (STEPS) is the principal tool used to track adult tobacco use in a way that is comparable across countries3,4, and its pooled multi-country files make it possible, for the first time at this scale, to ask not only how many adults smoke but how unevenly the world is succeeding at helping them stop.
Levesque et al.5 Access to Health Care framework offers a structured way to ask that second question. The framework describes access as arising from the fit between five health system characteristics: approachability, acceptability, availability and accommodation, affordability, and appropriateness, and five corresponding abilities of the population served: to perceive a need for care, to seek it, to reach it, to pay for it, and to engage with it5. A scoping review of the framework’s use across health services found it has been applied widely, but that its application to tobacco cessation specifically remains limited6, which is part of the gap this article addresses. Related Zambia- and Africa-focused tobacco research by our group has examined tobacco initiation, school-based curriculum exposure, cessation counseling, cigarette availability and affordability, co-occurring alcohol use, and secondhand smoke exposure including among school-going adolescents7-13. Adult STEPS data do not contain the same direct measure of receiving professional cessation help that youth surveys do, but it does contain something the youth surveys generally lack: diagnosed comorbidities (hypertension, diabetes) and co-occurring risk behaviors (harmful alcohol use, physical inactivity) that plausibly shape whether an adult smoker perceives a personal, embodied need to quit, independent of any external messaging. This study treats those comorbidity and risk-behavior measures as adult-specific ability to perceive indicators, tobacco-control policy score, price, and tax (available for the African subset of countries) as ability to reach and ability to pay indicators, and the quit ratio itself, the standard adult tobacco-surveillance indicator of successful cessation, as the ability to engage outcome.
A second gap this study addresses is spatial and temporal resolution. Prior pooled analyses of multi-country survey data have generally reported a single global or single-country estimate; treating the world’s smokers as one population, or one country’s smokers in isolation, at one point in time, obscures the fact that WHO regions differ enormously in tobacco epidemic stage, health system maturity, and policy environment, and that any of these could be moving in different directions over time. Global Burden of Disease modeling of smoking prevalence and, separately, of youth smoking initiation across 204 countries and territories, has likewise shown that spatial and demographic patterns of tobacco use and its attributable burden diverge sharply once disaggregated below the global level, rather than following a single worldwide trajectory14,15. This analysis therefore deliberately estimates the cessation cascade separately for each of the five WHO regions represented in the pooled file (AFRO, EMRO, EURO, PAHO, WPRO) and includes survey year as an explicit covariate throughout, so that regional and temporal patterns can be examined directly rather than averaged away.
Consistent with a structured, transparent approach to variable selection for population survey secondary analyses, in which a demographic and socioeconomic core (age, sex, education level, residence, marital status, region, and survey year) is retained in every model regardless of statistical significance, while further predictors are chosen for theoretical relevance to a named access domain, prior empirical precedent, and comparability across countries16, this study had four aims: first, to describe the adult smoking quit ratio in the pooled sample and by WHO region and survey year; second, to identify demographic, socioeconomic, and comorbidity determinants of cessation overall and within each region separately; third, to examine, for the subset of African countries with linked policy data, whether the tobacco-control policy environment is independently associated with cessation once survey year is properly accounted for; and fourth, to generate simple, explicitly illustrative trend projections of the quit ratio to 2050, for the pooled sample and by region, as a way of showing what continuation of currently observed trends would imply, while being transparent about the considerable limits of that exercise.
METHODS
Study design and data source
This study was a secondary analysis of pooled individual-level microdata from national WHO STEPwise approach to noncommunicable disease risk factor surveillance (STEPS) surveys conducted between 2012 and 2023. The analytic dataset was derived from a larger pooled STEPS database comprising surveys from 89 countries and originally covering the period 2002–2023. For 31 of 35 African countries represented in the pooled database, individual-level survey data had additionally been linked at the country level to independently compiled tobacco-control policy indicators, including overall policy restrictiveness, retail cigarette price, excise tax share of retail price, and marketing and availability restriction scores. Comparable linked policy data were not available for countries outside the African Region; consequently, analyses of the tobacco-control policy environment were restricted to Africa.
Ethics
Each contributing STEPS survey was conducted under standardized international protocols, with ethical approval and informed consent obtained during primary data collection by the relevant national ministry of health in collaboration with WHO. This secondary analysis used fully anonymized, pooled, de-identified microdata and posed no risk to individual participants; no additional ethical approval was required.
Handling of the pre-2012 data quality limitation
Although the original pooled database included surveys conducted before 2012, preliminary data-quality assessment identified a systematic limitation in the smoking-status variable for the earlier survey years. All available surveys conducted between 2002 and 2011 recorded a quit ratio of exactly 0%, irrespective of WHO region. A complete absence of former smokers across multiple countries and regions over an entire decade was considered epidemiologically implausible and suggested that earlier survey instruments, harmonization procedures, or the pooling process did not reliably distinguish former smokers from current smokers. For this reason, the analytic period for the present study was restricted to surveys conducted from 2012 through 2023. This restriction was applied following the preliminary data-quality assessment to minimize potential misclassification of former smokers in the earlier survey years. After applying this restriction and limiting the cessation analysis to participants classified as ever smokers, the analytic sample comprised 54460 adults. The possibility of residual heterogeneity in smoking-status measurement across survey rounds cannot be excluded and is considered further in the Limitations section.
Study variables and operational definitions
Predictor variables were defined and harmonized a priori to maximize comparability across participating WHO STEPwise approach to noncommunicable disease risk factor surveillance (STEPS) surveys while preserving the substantive meaning of the original survey measures17. The analysis included demographic and socioeconomic characteristics, diagnosed cardiometabolic conditions, behavioral risk factors, WHO region, and survey year. Where country-specific response categories differed, variables were collapsed into common analytic categories that could be applied consistently across contributing surveys and survey rounds. Demographic and socioeconomic predictors comprised WHO region, age, sex, education level, place of residence, and marital status. WHO region was classified as the African Region (AFRO), Eastern Mediterranean Region (EMRO), European Region (EURO), Region of the Americas (PAHO), or Western Pacific Region (WPRO). Age was based on completed years at the time of survey and grouped as 18–29, 30–39, 40–49, 50–59, or 60–69 years. The upper age category ended at 60–69 years because the standard WHO STEPS surveillance population comprises adults aged 18–69 years; individuals aged ≥70 years therefore fall outside the standard STEPS target age range. Sex was classified as male or female. Education level was recorded in the harmonized dataset and was grouped as no formal education, primary, secondary, or tertiary education. Place of residence was classified as rural or urban according to the designation used in the contributing national STEPS survey. Marital status was harmonized as currently married, formerly married, or never married; formerly married comprised participants recorded as divorced, separated, or widowed. Survey year was defined as the calendar year in which the contributing national STEPS survey was conducted and was modeled continuously in the multivariable analyses, rescaled to decades since 2012 so that the corresponding odds ratio represented the change associated with a 10-year increase in survey year.
Diagnosed hypertension and diagnosed diabetes were treated as indicators of previously identified disease rather than disease newly determined from measurements obtained during the STEPS examination18. Diagnosed hypertension was coded as present when a participant reported having previously been told by a doctor or other health professional that they had raised blood pressure or hypertension, and absent otherwise. Diagnosed diabetes was similarly coded as present when a participant reported having previously been told by a doctor or other health professional that they had raised blood glucose or diabetes, and absent otherwise. Accordingly, the ‘not diagnosed’ categories do not establish the absence of hypertension or diabetes and may include participants with undiagnosed disease. These variables were therefore interpreted as markers of recognized cardiometabolic disease and potential previous contact with health services rather than measures of the underlying population prevalence of hypertension or diabetes.
Behavioral risk factors comprised harmful alcohol use and physical activity. Harmful alcohol use was operationalized using the three-item Alcohol Use Disorders Identification Test–Consumption (AUDIT-C), which captures drinking frequency, typical quantity consumed, and frequency of heavy drinking. AUDIT-C scores range from 0 to 12, with harmful alcohol use classified as a score ≥3 among women and ≥4 among men; scores ≤2 among women and ≤3 among men were classified as no harmful alcohol use18-20. Physical activity was assessed across the work, transport, and recreational domains captured by the WHO STEPS instrument and expressed as metabolic equivalent task (MET)-minutes per week21. Participants accumulating <600 MET-minutes per week were classified as having insufficient physical activity, whereas those achieving ≥600 MET-minutes per week were classified as having sufficient physical activity. These behavioral indicators were included as potentially modifiable risk factors that may coexist with smoking and influence both perceived health risk and successful cessation.
Smoking status was derived from the harmonized STEPS tobacco-use variables and classified as never, current, or former smoking. Never smokers were participants without a history of smoking and were excluded from the cessation analysis. Ever smokers comprised current and former smokers. Current smokers were participants reporting current smoking at the time of the survey, whereas former smokers had a history of smoking but were no longer smoking. The primary individual-level outcome, successful smoking cessation, was coded as 1 for former smokers and 0 for current smokers among ever smokers. Separately, the quit ratio was used as a descriptive population measure and calculated as the weighted number of former smokers divided by the weighted total number of ever smokers (former smokers plus current smokers), multiplied by 100. Thus, the quit ratio described the population proportion of ever smokers who had quit, whereas the logistic regression models estimated the adjusted odds that an individual ever smoker was a former rather than a current smoker.
The quit-attempt indicator was examined as a secondary exploratory measure of active cessation behavior. Among current smokers, a recent quit attempt was defined as reporting an attempt to stop smoking during the preceding 12 months. Because this item was available in only a small subset of contributing surveys and was inconsistently populated across countries, it was summarized descriptively and was not included in the multivariable regression models. For multivariable regression, reference categories were selected a priori to provide epidemiologically interpretable comparisons. These were AFRO for WHO region, 18–29 years for age, male sex, no formal education, rural residence, never married, no diagnosed hypertension, no diagnosed diabetes, no harmful alcohol use, and sufficient physical activity. Predictor inclusion was theory-driven rather than data-driven: all variables were retained on the basis of their prespecified conceptual relevance to smoking cessation, potential confounding role, correspondence with the Levesque Access to Health Care framework, and comparability across participating STEPS surveys, irrespective of statistical significance in bivariate analyses.
Levesque framework mapping
Predictor variables were selected a priori based on the Levesque Access to Health Care framework16, established epidemiological evidence on smoking cessation, their potential roles as demographic or socioeconomic confounders, and their availability and comparability across contributing WHO STEPS surveys. Age, sex, education level, place of residence, marital status, WHO region, and survey year constituted the core adjustment set and were retained in all multivariable models irrespective of their statistical significance. Diagnosed hypertension, diagnosed diabetes, harmful alcohol use, and physical activity were additionally included because of their theoretical and empirical relevance to smoking cessation and their correspondence with the ability-to-perceive domain of the Levesque framework (Table 1). Predictor inclusion was therefore theory-driven rather than based on bivariate statistical significance or automated variable-selection procedures.
Table 1
Adult STEPS indicators mapped to Levesque’s access dimensions
[i] A genuine product-type breakdown (for example cigarettes vs smokeless tobacco) was not possible with this pooled extract, which retains only a single consolidated current/ever tobacco-use indicator rather than the product-specific items collected in the original country instruments; this is addressed in the Limitations.
Statistical analysis
Categorical variables were summarized using frequencies and percentages, and the quit ratio was calculated within demographic, socioeconomic, behavioral, comorbidity, and regional subgroups. Weighted descriptive percentages and quit ratios were calculated using the WHO STEPS Step 1 sampling weight (wstep1), while unweighted sample counts are reported to indicate the observed number of participants underlying each estimate22. Differences in quit ratios across categorical predictor groups were examined descriptively using rescaled Pearson chi-squared tests based on the weighted cross-tabulations. Because these chi-squared comparisons did not incorporate the full PSU and stratification structure used for the regression variance estimation, they were treated as approximate bivariate comparisons rather than fully design-based hypothesis tests. For multivariable analyses, the study population was restricted to ever smokers, defined as current or former smokers, with successful smoking cessation coded as 1 for former smokers and 0 for current smokers. Thus, the quit ratio described the weighted proportion of former smokers among ever smokers, whereas the regression models estimated the adjusted odds that an individual ever smoker was a former rather than a current smoker. The multivariable regression analyses incorporated the WHO STEPS complex survey design using the primary sampling unit (psu), sampling stratum (stratum), and Step 1 sampling weight (wstep1). Because psu and stratum codes were unique only within countries, country-stratum and country-stratum-psu composite identifiers were created to prevent clusters or strata with the same numeric codes in different countries from being pooled.
Multivariable associations with successful smoking cessation were estimated using survey-weighted logistic regression, with adjusted odds ratios (AORs), 95% confidence intervals (CIs), and p-values reported22. The pooled model included age, sex, education level, place of residence, marital status, diagnosed hypertension, diagnosed diabetes, harmful alcohol use, physical activity, WHO region, and survey year; covariates were selected a priori on conceptual and epidemiological grounds and retained irrespective of statistical significance. Survey year was modeled continuously and rescaled to decades since 2012 to facilitate interpretation of temporal associations. To examine geographical heterogeneity, the same core model was fitted separately within each of the five WHO regions, with these models intended to describe regional variation rather than formally test interactions. The Africa-specific tobacco-control policy analysis was restricted to observations with linked policy data and added tobacco-control policy category to the core individual-level covariates and survey year. Model parameters were estimated by weighted maximum likelihood using wstep1, rescaled so that the sum of weights equaled the analytic sample size, and standard errors were obtained using the linearized ultimate-cluster variance estimator for a stratified, multistage, with-replacement survey design.
Design degrees of freedom for confidence intervals and hypothesis tests were calculated as the number of primary sampling units minus the number of strata in the relevant analytic sample, and inference used a t-distribution on these degrees of freedom rather than a normal reference distribution. Records missing psu, stratum, or wstep1 were excluded from the regression analytic sample, and region-specific and Africa-restricted models used the same survey-weighted estimation and variance approach through restriction of the survey design object to the relevant subpopulation. Illustrative temporal extrapolations were conducted separately from the multivariable analyses using simple logistic regression models with survey year as the sole predictor, fitted overall and by WHO region; fitted logit-linear trends were used to estimate quit ratios for 2024, 2030, 2040, and 2050 and were compared with a conservative scenario in which the mean observed quit ratio during 2018–2023 was held constant. These projections were interpreted as illustrative extrapolations of observed survey trends rather than validated epidemiological forecasts. All tests were two-sided, with p<0.05 considered statistically significant. Analyses were conducted using Python version 3.14.7 with pandas version 3.0.5 and SciPy version 1.18.0, and regression results were cross-checked using R version 4.6.1.
The survey-weighted logistic regression model, weighted maximum-likelihood estimating equation, and linearized ultimate-cluster variance estimator are given in Supplementary file Material 1.
Weighted logistic regression model assumptions
Regression diagnostics indicated no evidence of problematic multicollinearity in the pooled survey-weighted model. Generalized variance inflation factors were evaluated for all model terms and, for categorical predictors with more than one degree of freedom, interpreted using the dimension-adjusted measure GVIF1/2df to allow comparison across terms. In the pooled model, adjusted GVIF values ranged from 1.014 for harmful alcohol use to 1.254 for survey year; WHO region, marital status, and education level had adjusted GVIF values of 1.143, 1.132, and 1.104, respectively. These values were well below commonly used thresholds for concerning multicollinearity, indicating that the estimated associations were unlikely to have been materially distorted by linear dependence among the included covariates. Detailed predictor-level GVIF results are presented in Supplementary file Table S4, while a consolidated summary of regression diagnostics across all fitted models is provided in Supplementary file Table S5. Where the quadratic survey-year term indicated evidence of non-linearity, the prespecified linear year term was retained to provide a parsimonious and comparable summary of the average temporal association across models; however, the corresponding AOR per decade was interpreted as an average association over the observed survey period rather than as evidence of a constant linear change in the log(odds of cessation).
Particular attention was given to the specification of survey year, because it was the only continuous predictor in the multivariable models and was also the sole predictor in the logit-linear models used for temporal extrapolation. The functional form and overall behavior of the year-based models were therefore considered as part of the regression-diagnostic assessment rather than treating the extrapolation models as independent forecasting procedures. Supplementary file Table S5 summarizes these model-level diagnostics for the pooled and region-specific analyses, including the models used to characterize annual temporal patterns. These diagnostic assessments informed both the treatment of survey year in the regression analyses and the interpretation of the subsequent extrapolations. Where year-based models showed limited statistical support, instability, or other indications that a simple linear temporal specification should be interpreted cautiously, this was carried forward explicitly into the interpretation of the projected values rather than treating the fitted trajectory as evidence of a continuing population trend.
This distinction was especially important for the extrapolation analysis. The projected quit ratios were generated from simple models in which survey year was the sole predictor, and therefore necessarily assume that the estimated logit-linear relationship observed during 2012–2023 can be extended beyond the observed data period. The regression diagnostics summarized in Supplementary file Table S5 were consequently used as an additional guide to the reliability and interpretation of these extrapolations. The projections were retained as illustrative sensitivity analyses, rather than validated forecasts, particularly where the underlying year effect was weak, statistically non-significant, or estimated imprecisely. This diagnostic-informed interpretation prevents numerical extrapolations from being given greater evidential weight than is supported by the underlying temporal model.
RESULTS
Sample derivation and analytic samples
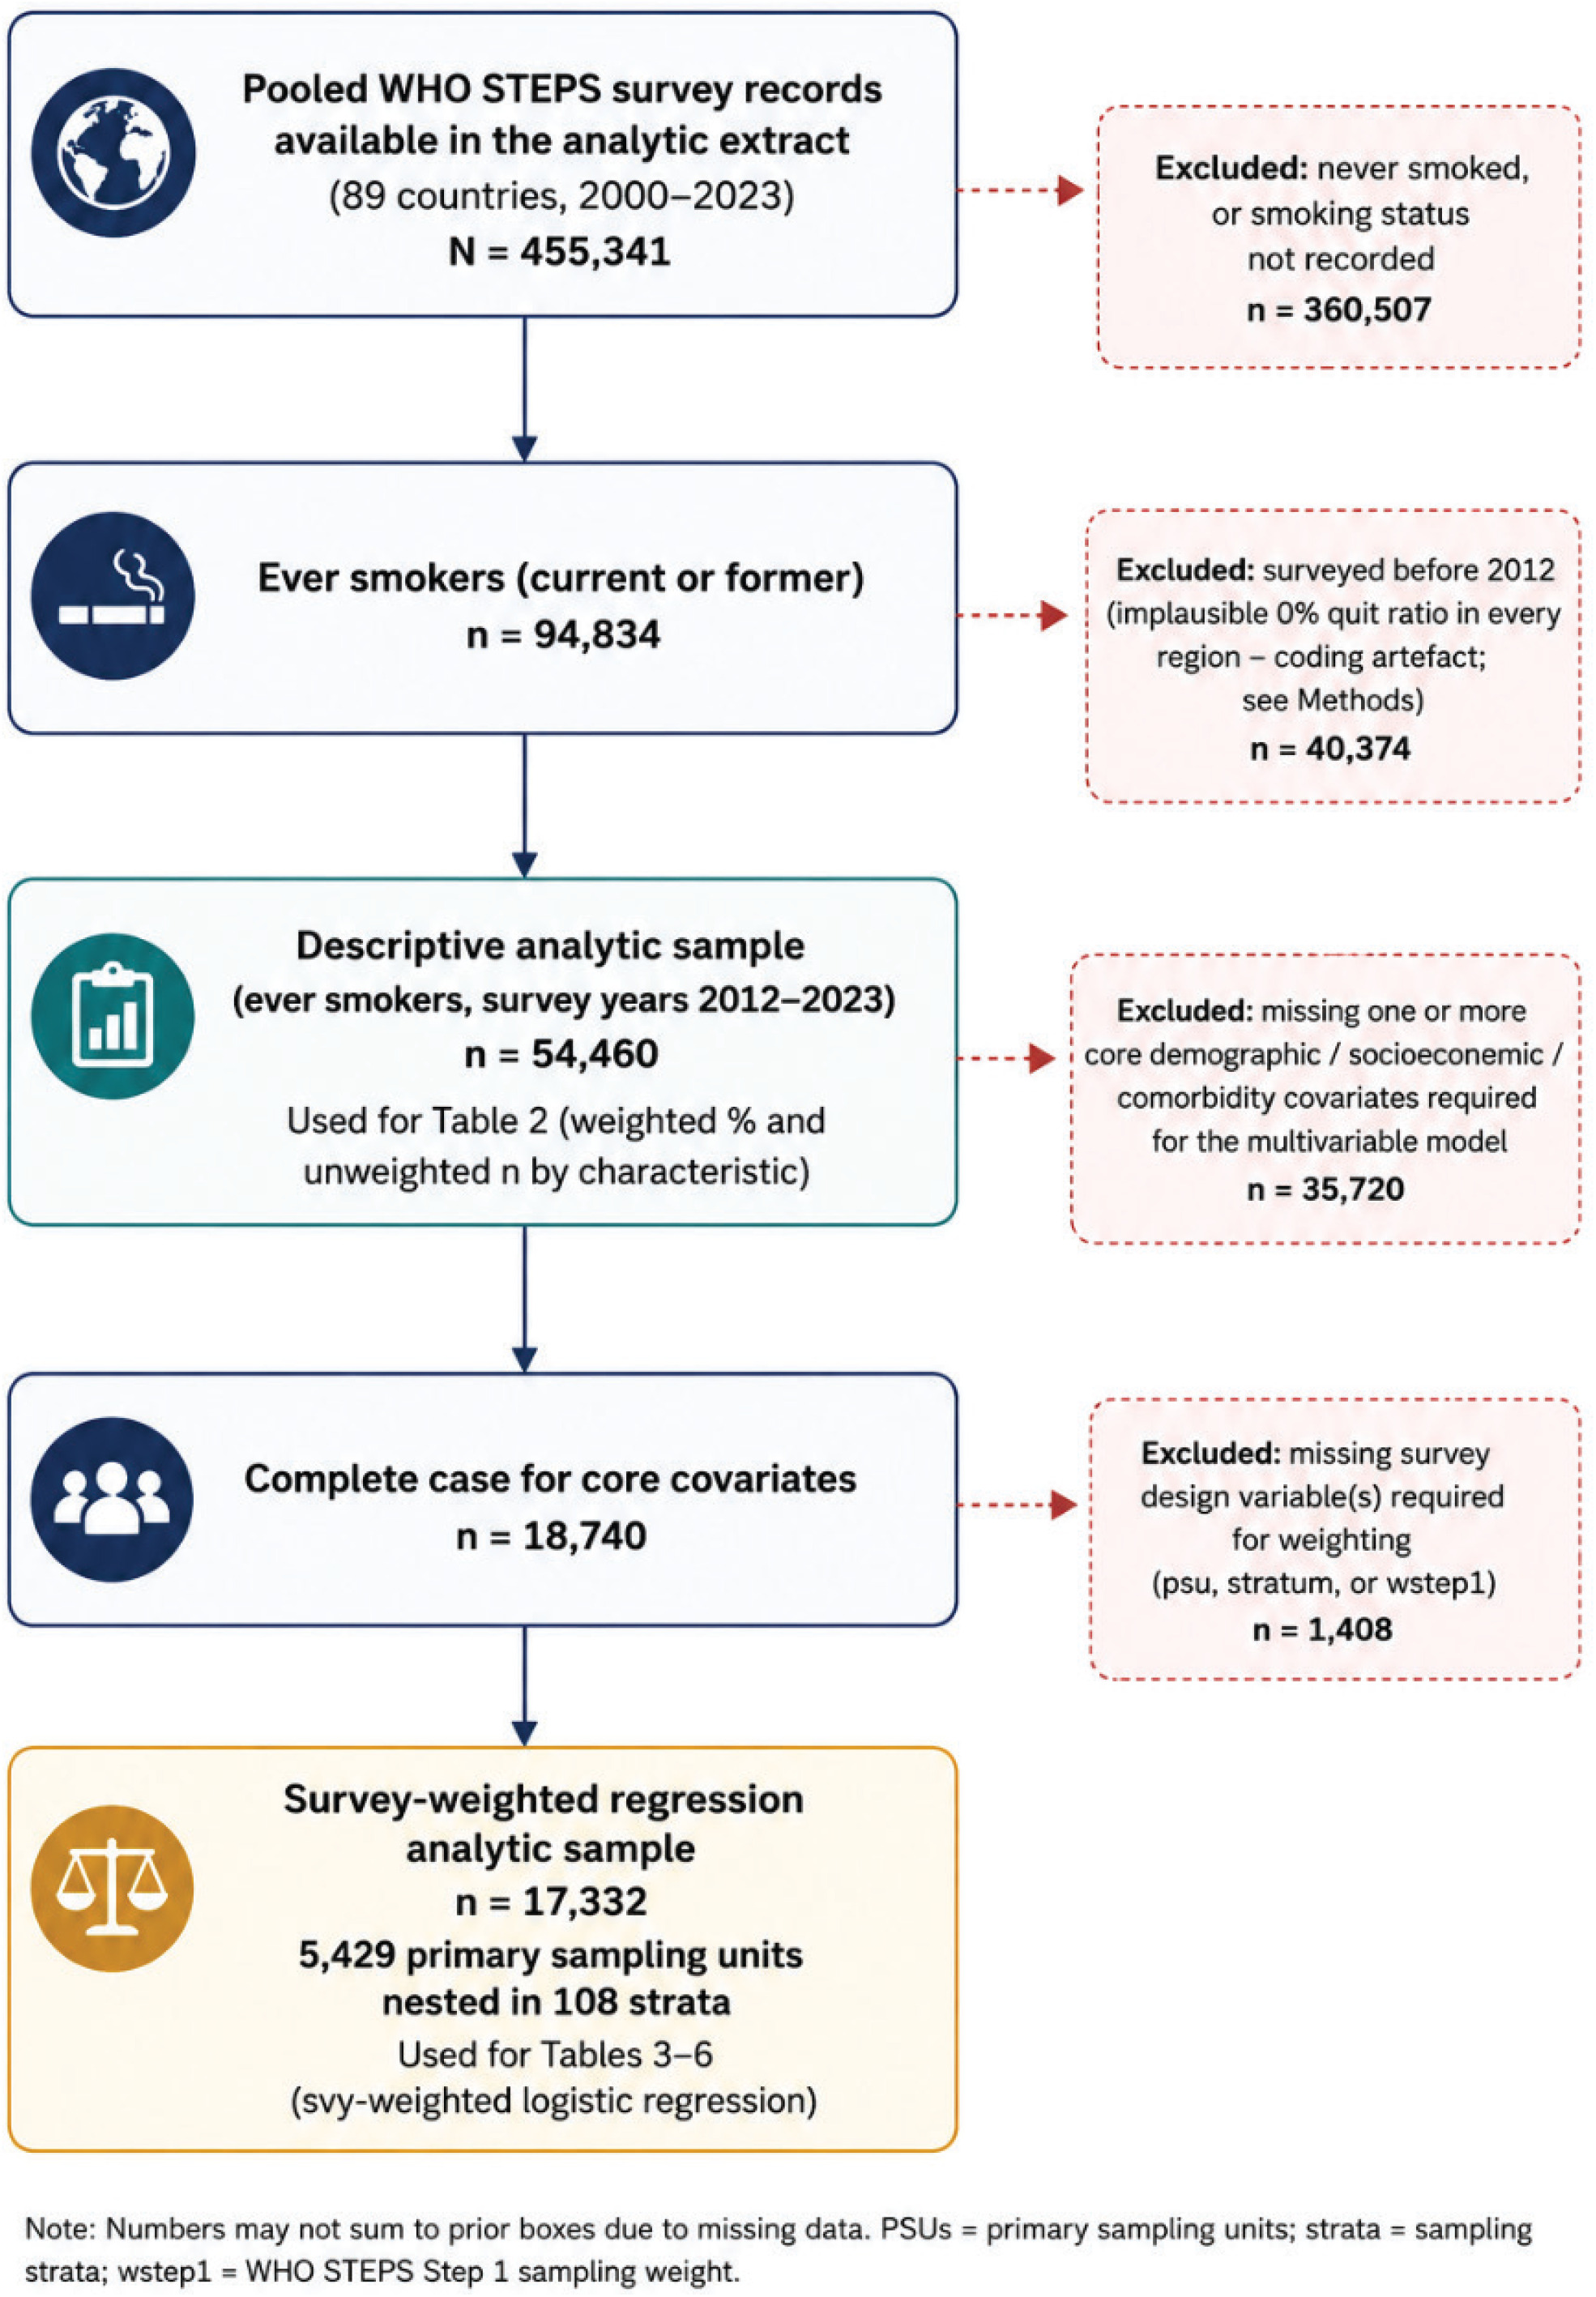
Figure 1 summarizes how the analytic samples were derived from the pooled WHO STEPS extract of 455341 records across 89 countries. After excluding respondents who had never smoked and restricting to survey years 2012–2023, the descriptive analytic sample comprised 54460 ever smokers. Restriction to respondents with complete information for the core covariates reduced this to 18740 ever smokers. Exclusion of a further 1408 respondents with missing survey-design information (psu, stratum, or wstep1) produced the final survey-weighted regression analytic sample of 17332 ever smokers, nested in 5429 primary sampling units across 108 strata. The loss from the descriptive to the regression sample therefore occurred in two sequential steps: incomplete core covariate data (n=35720 excluded), followed by missing survey-design variables (n=1408 excluded).
Sample characteristics
Table 2 summarizes the characteristics of the descriptive and survey-weighted regression analytic samples. The descriptive analytic sample included 54460 ever smokers from 59 countries, whereas the survey-weighted regression sample included 17332 ever smokers from 45 countries. Regional representation changed notably after restriction: EURO increased from 22.6% to 51.3% of the weighted sample, while WPRO declined from 38.8% to 11.7% and PAHO from 3.8% to 1.0%; AFRO increased modestly from 22.7% to 25.9%. Age, residence, marital status, and diagnosed hypertension were comparatively stable between samples. More pronounced differences were observed for sex and education: women increased from 9.3% to 14.4%, while tertiary education increased from 22.4% to 34.6% and no formal education declined from 29.6% to 16.7%. Harmful alcohol use decreased from 6.6% to 2.8%, whereas diagnosed diabetes declined from 6.2% to 4.7%. Former smokers represented 31.1% of the descriptive sample and 36.9% of the regression sample.
Table 2
Characteristics of the descriptive and survey-weighted regression analytic samples of adult ever smokers from pooled cross-sectional WHO STEPS surveys across five WHO regions, 2012–2023 (descriptive sample, N=54460; regression sample, N =17332)
[i] Weighted percentages estimate the population distribution using the Step 1 sampling weight (wstep1), and unweighted n represents the observed number of respondents underlying each estimate. WHO region and smoking status are reported for the full descriptive cohort (n=54460). For age, sex, harmful alcohol use, and physical activity, the available-case denominator is n=52014; denominators for education level, residence, marital status, hypertension, and diabetes are smaller because of additional item-level non-response. Weighted percentages were calculated among participants with non-missing information for the relevant characteristic. The descriptive sample included participants from 59 countries, whereas the regression sample included 17332 participants from 45 countries with complete core covariates and complete survey-design information (psu, stratum, and wstep1).
Restriction to complete survey-design variables and core covariates reduced the analytic sample by 37128 participants, from 54460 to 17332, meaning that 31.8% of the original descriptive sample was retained and 68.2% was excluded from the survey-weighted regression analysis. This reduction reflects both missing survey-design information and incomplete covariate data rather than item non-response alone. The relative stability of age, residence, marital status, hypertension, and physical activity distributions suggests limited compositional change for these characteristics; however, the substantial shifts in WHO region, education level, harmful alcohol use, sex, and smoking status indicate that missingness and design-variable availability were not compositionally neutral. Consequently, regression estimates should be interpreted as representative of the complete-case, survey-design-eligible analytic population rather than assumed to reproduce exactly the composition of the full descriptive sample. Because of variable-specific missing data, the available-case denominators for some characteristics in Table 2 were smaller than the overall descriptive analytic sample of 54460 participants.
Smoking cessation
Among 54460 adult ever smokers surveyed between 2012 and 2023, the survey-weighted quit ratio was 31.1%. The corresponding unweighted quit ratio was 30.1% (16398 former smokers/54460 ever smokers). Weighted quit ratios varied more than two and a half fold across WHO regions: 63.2% in the Americas, 38.3% in Africa, 31.9% in Europe and Central Asia, 25.3% in the Eastern Mediterranean, and 25.0% in the Western Pacific (Figure 2; weighted χ2=1684.8, df =4, p<0.001).
Figure 2
Survey-weighted quit ratio among adult ever smokers across five WHO regions in pooled cross-sectional WHO STEPS surveys, 2012–2023 (N=54460)
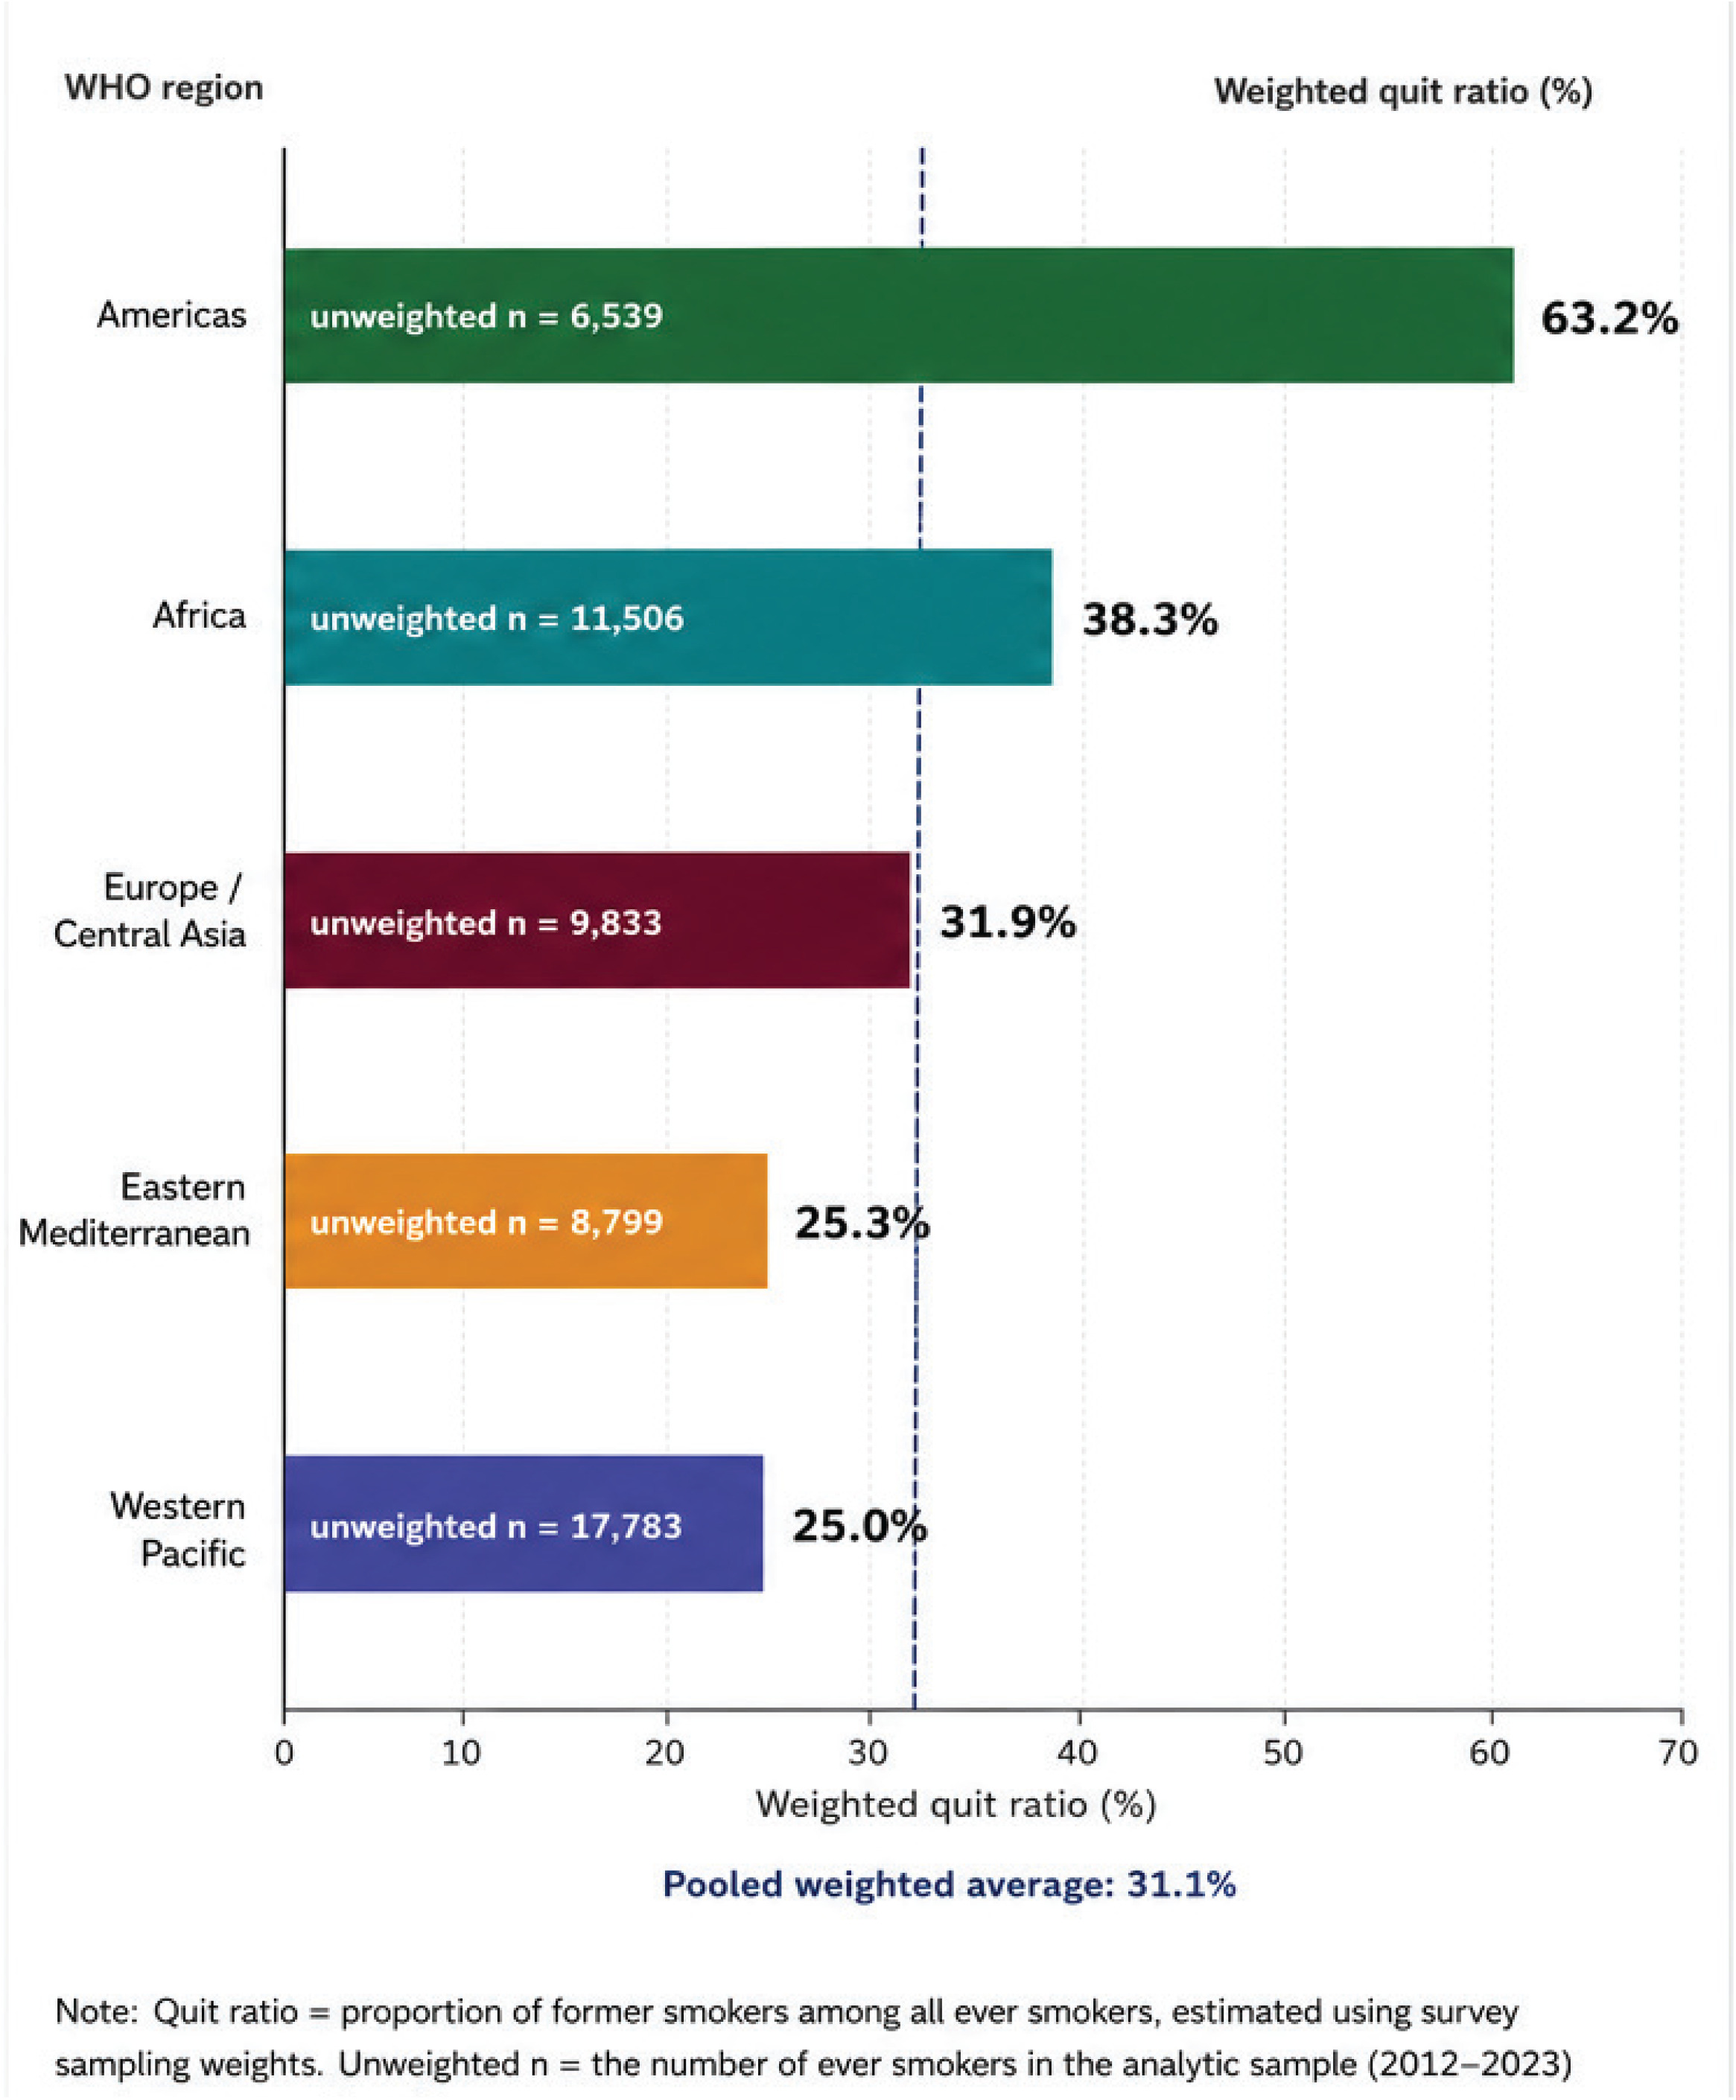
Table 3 reports the weighted quit ratio and unweighted n for every demographic, socioeconomic, and comorbidity group examined. The clearest gradient was by age: the weighted quit ratio rose from 23.9% among those aged 18–29 years to 48.7% among 60–69 years. Women had a higher weighted quit ratio than men (40.6% vs 30.1%), as did people with tertiary education compared with no formal education (37.3% vs 30.8%), and people with diagnosed hypertension compared with those without (41.4% vs 33.3%). Harmful alcohol use and diagnosed diabetes were both associated with a lower weighted quit ratio (23.1% and 22.4% respectively, against 31.6% and 32.5% among those without). Physical activity level showed no meaningful weighted difference (30.9% vs 31.1%, p=0.818), the one characteristic in Table 3 that was not significantly associated with cessation at the bivariate level.
Table 3
Survey-weighted quit ratio according to demographic, socioeconomic, comorbidity and behavioral characteristics among adult ever smokers in pooled WHO STEPS surveys across five WHO regions, 2012–2023 (N=54460)
[i] Weighted quit ratio: weighted proportion of former smokers among ever smokers within each group using the Step 1 sampling weight (wstep1). Chi-squared statistics are rescaled Pearson tests based on weighted cross-tabulations and should be interpreted as approximate descriptive comparisons rather than fully design-based tests. Unweighted n indicates the observed sample underlying each weighted estimate. WHO-region denominators sum to the full descriptive sample (n=54460); denominators for other characteristics are available-case totals and are smaller where item-level data are missing.
Pooled survey-weighted multivariable model
Supplementary file Table S2 and Figure 3 present the pooled survey-weighted multivariable model (n=17332; 5429 PSUs nested in 108 strata; design df=5321). Age, sex, tertiary education, marital status, hypertension, harmful alcohol use, physical activity, and WHO region all remained independently associated with cessation after weighting. Adults aged 60–69 years had almost three times the adjusted odds of cessation of people aged 18–29 years (AOR=2.96%, 95% CI: 2.24–3.92), and women had higher adjusted odds than men (AOR=1.37; 1.10–1.69). Tertiary education remained associated with higher cessation (AOR=1.60; 1.25–2.04), while primary and secondary education were not significantly different from no formal education once the full designbased model was fitted. Diagnosed hypertension was associated with higher odds of cessation (AOR=1.31; 95% CI: 1.09–1.57), while harmful alcohol use showed the largest observed inverse association with cessation (AOR=0.32; 95% CI: 0.19–0.53). Diagnosed diabetes was not independently associated with cessation (AOR=0.92; 0.60–1.43, p=0.721), echoing the unweighted finding. Relative to Africa, the adjusted odds of cessation were significantly lower in the Eastern Mediterranean (AOR=0.58), Europe and Central Asia (AOR=0.34), and the Western Pacific (AOR 0.36), and not significantly different in the Americas (AOR=1.27, p=0.339).
Figure 3
Survey-weighted adjusted odds ratios and 95% confidence intervals for factors associated with successful smoking cessation among adult ever smokers across five WHO regions in pooled cross-sectional WHO STEPS surveys, 2012–2023 (N=17332; 5429 PSUs; 108 strata)
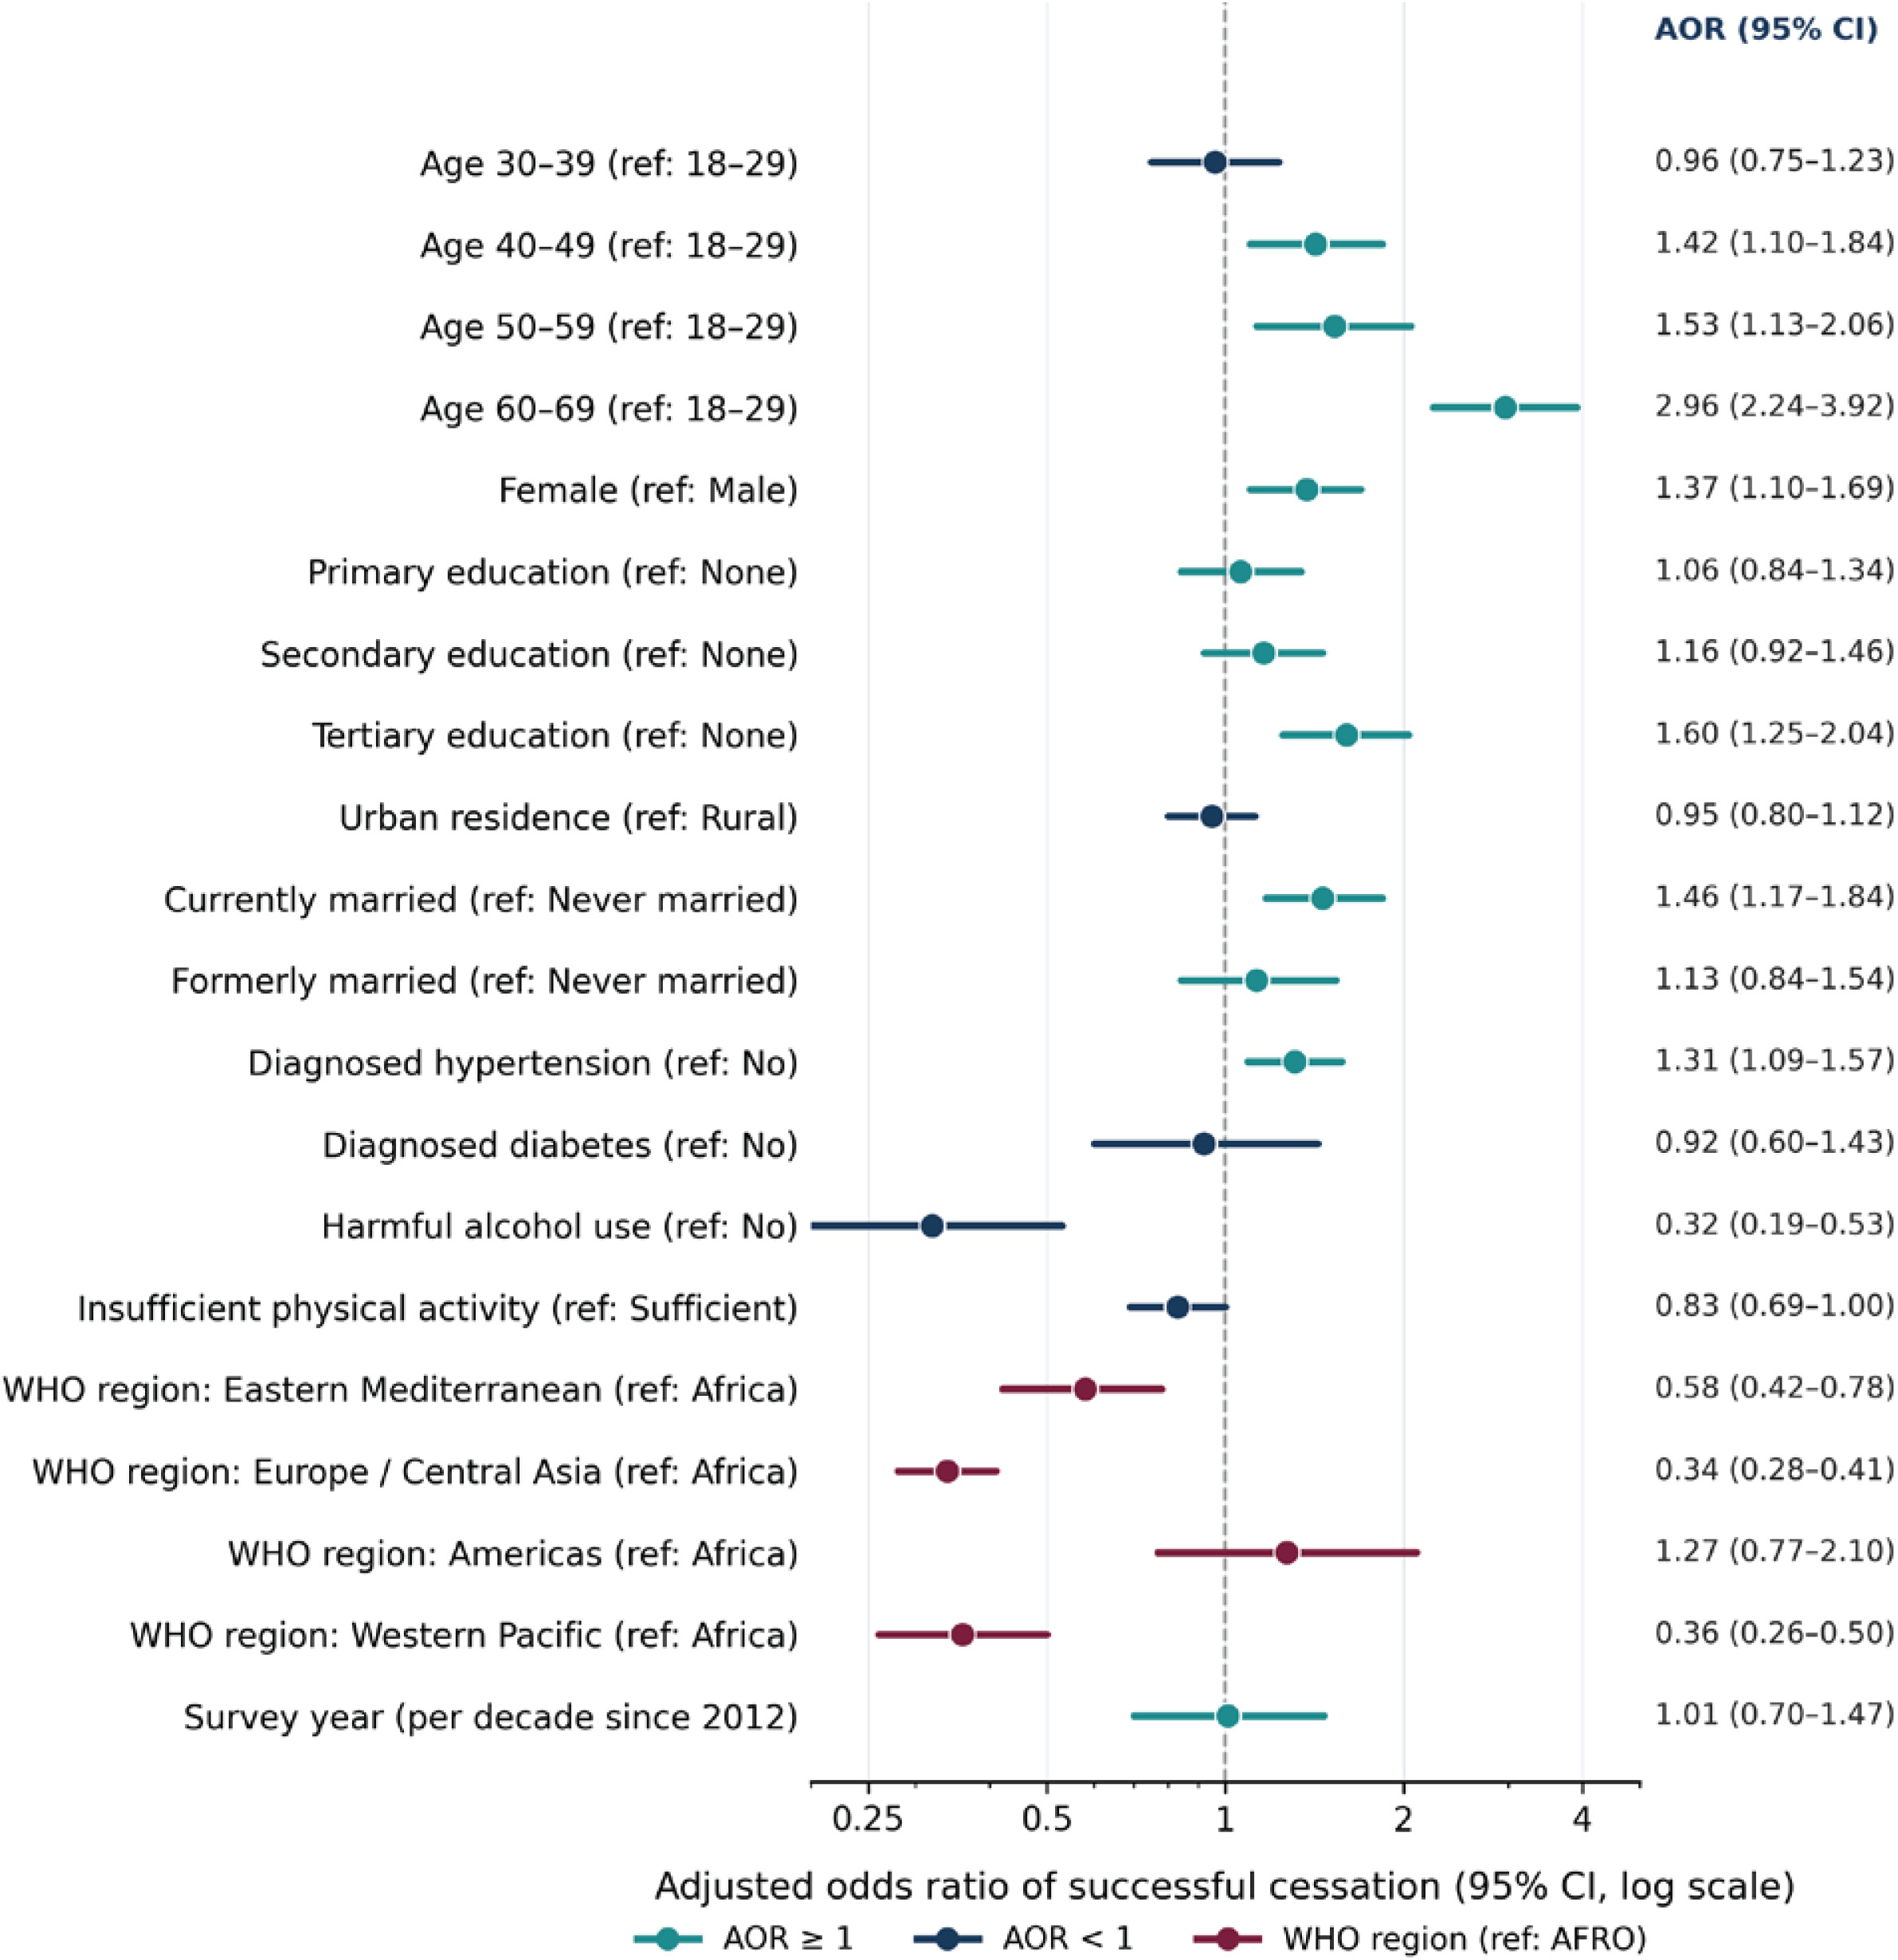
In the pooled survey-weighted multivariable model, the linear survey-year term was not statistically associated with successful smoking cessation (AOR per decade=1.01; 95% CI: 0.70–1.47; p=0.940). Diagnostic assessment nevertheless indicated evidence of non-linearity in the pooled survey-year association (quadratic-year Wald p=0.001), so the linear AOR should be interpreted as an average temporal association across 2012–2023 rather than as a constant decade-on-decade effect. Region-specific models showed heterogeneity in the linear temporal associations: survey year was positively associated with cessation in AFRO (AOR per decade =2.72; 95% CI: 1.34–5.51; p=0.006) and negatively associated in EMRO (AOR=0.27; 95% CI: 0.09–0.83; p=0.023), while no statistically significant linear survey-year associations were observed in EURO, PAHO, or WPRO. Evidence of non-linearity was also observed in AFRO (quadratic-year Wald p<0.001), whereas the corresponding tests were not statistically significant in the other regional models. Full estimates and diagnostic results are presented in Supplementary file Tables S1 and S5.
Region-specific survey-weighted models
Region-specific survey-weighted models are presented in Supplementary file Table S1. The adjusted association between age and cessation varied in magnitude across regions, with the AOR for adults aged 60–69 years relative to those aged 18–29 years ranging from 2.11 in EURO to 14.52 in PAHO. Harmful alcohol use was associated with lower odds of cessation in AFRO (AOR=0.23; 95% CI: 0.12–0.45) and EMRO (AOR=0.04; 95% CI: 0.00–0.43), with estimates in some other regions being less precise. Tertiary education was associated with higher odds of cessation in AFRO, PAHO, and WPRO, whereas in EMRO it was associated with lower odds of cessation (AOR=0.40; 95% CI: 0.20–0.81). Survey year was positively associated with cessation in AFRO (AOR per decade =2.72; 95% CI: 1.34–5.51; p=0.006) and negatively associated in EMRO (AOR=0.27; 95% CI: 0.09–0.83; p=0.023); no statistically significant survey-year associations were observed in EURO, PAHO, or WPRO. The PAHO model was based on 434 participants and produced several wide confidence intervals; these estimates are therefore reported with corresponding measures of uncertainty in Supplementary file Table S1.
Quit-attempt exploratory analysis (ability to seek)
The STEPS quit-attempt item was available for only six country surveys (Cook Islands, Kiribati, Solomon Islands, and Tonga, all WPRO, 2013–2017; Mali, AFRO, 2013; Ukraine, EURO, 2019), covering 526 current smokers in total. A recent quit attempt was reported by 314 of 522 current smokers with a usable binary response (60.2%, unweighted, since the sparse and geographically unrepresentative coverage of this item makes a weighted estimate no more meaningful than the raw figure). Given how limited and unrepresentative this coverage is, no multivariable model was fitted for quit attempts, and this result should not be generalized beyond the six contributing surveys. It is reported transparently to show what the ability to seek domain could, and could not, be evaluated within this dataset.
Tobacco-control policy environment and cessation within Africa (ability to reach and pay)
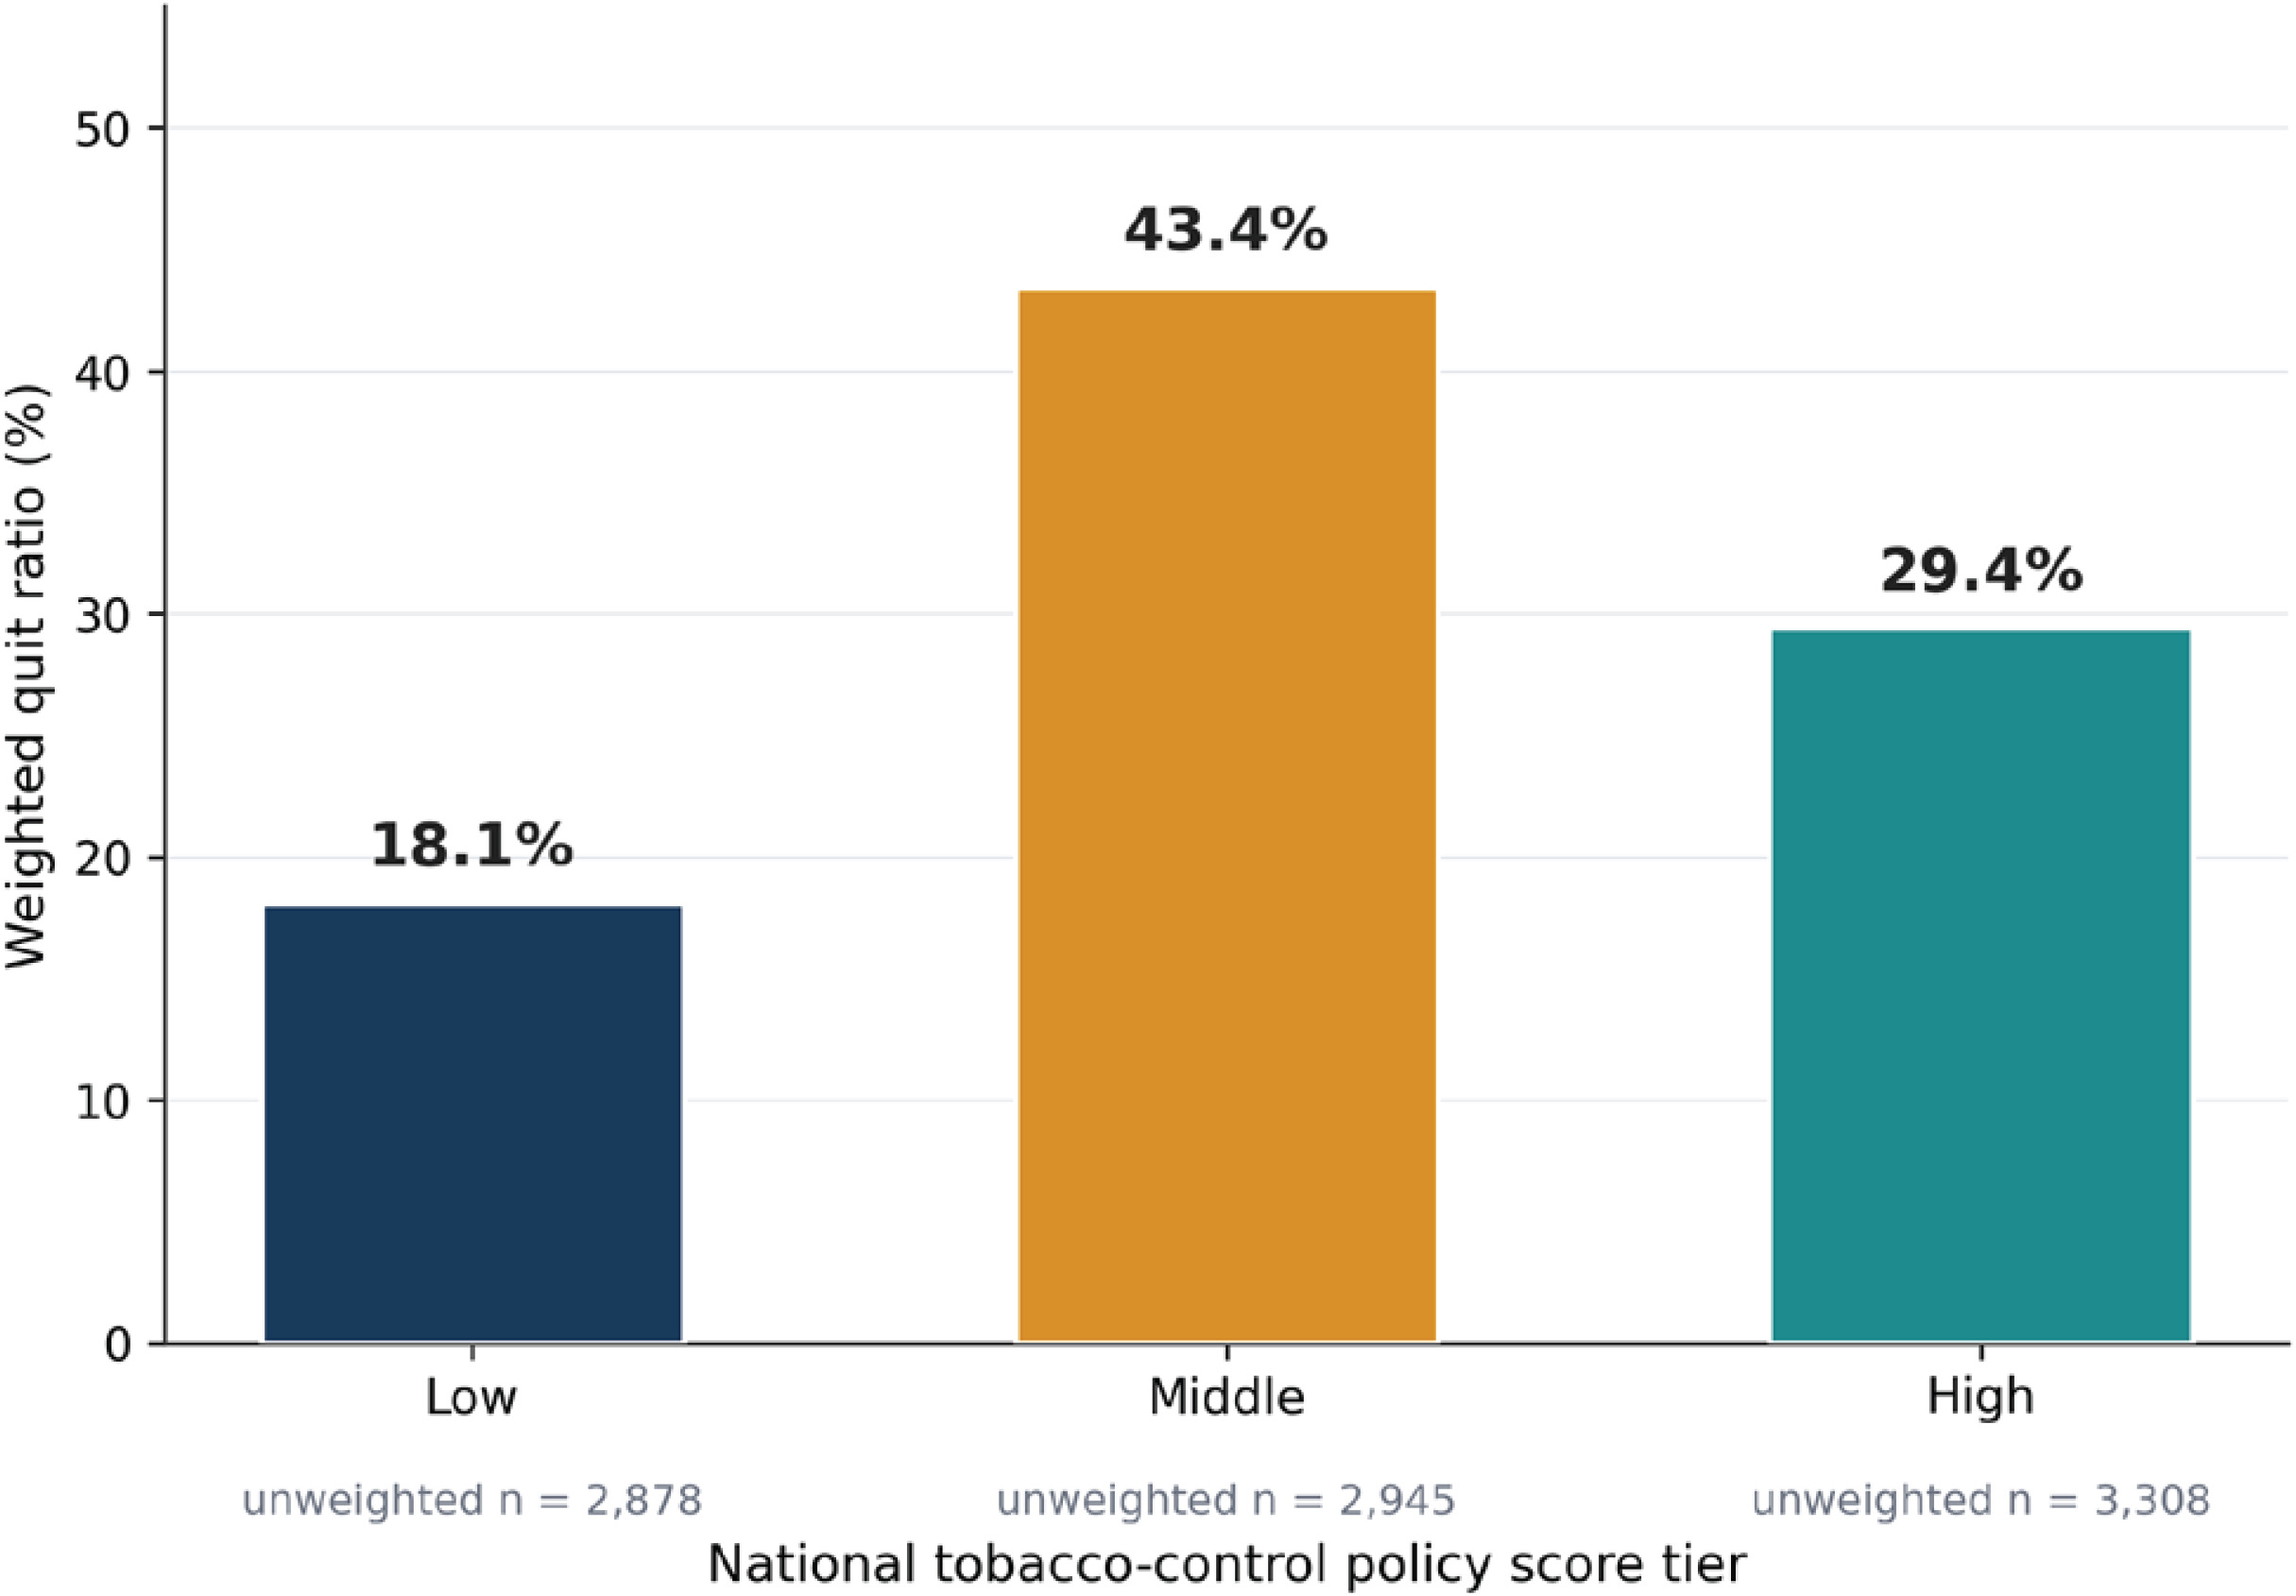
Tobacco-control policy data were available only for African countries; consequently, this analysis was restricted to the African subset. The weighted quit ratio was 18.1% among participants in countries classified in the low policy-score category, 43.4% in the middle category, and 29.4% in the high category (Figure 4). In the survey-weighted multivariable model (n=2520; 1331 PSUs; 50 strata), both the middle and high policy-score categories were associated with higher odds of successful cessation relative to the low category (middle vs low: AOR=2.45; 95% CI: 1.38–4.37; p=0.002; high vs low: AOR=1.75; 95% CI: 1.16–2.64; p=0.008). Tertiary education showed the largest positive association with cessation (AOR=4.33; 95% CI: 2.27–8.25; p<0.001), while harmful alcohol use was associated with lower odds of cessation (AOR=0.35; 95% CI: 0.18–0.68; p=0.002). Female sex, primary and secondary education, and survey year were also positively associated with cessation, whereas the remaining covariates were not statistically significant at the 5% level. Full model estimates are presented in Supplementary file Figure S1.
Illustrative trend projections, 2024–2050
Illustrative logit-linear extrapolations of the observed survey-year patterns were generated for 2024, 2030, 2040, and 2050 and compared with a conservative scenario in which the weighted mean quit ratio observed during 2018–2023 was held constant. In the pooled analysis, the extrapolated quit ratio increased modestly from 32.9% in 2024 to 34.4% in 2030, 36.8% in 2040, and 39.4% in 2050, compared with a held-constant estimate of 33.0%; however, the underlying year trend was not statistically significant (p=0.3994). Regional extrapolations were more heterogeneous. In AFRO, the corresponding estimates increased from 69.6% in 2024 to 85.6% in 2030, 96.7% in 2040, and 99.3% in 2050, compared with a held-constant estimate of 41.2%, with statistical evidence of an underlying temporal trend (p<0.001). In EMRO, the projected quit ratio increased from 41.5% to 80.0% between 2024 and 2050, compared with a held-constant estimate of 34.2% (p=0.0053).
Numerically increasing trajectories were also obtained for EURO (40.2% in 2024 to 74.7% in 2050; held constant 34.7%; p=0.1188) and PAHO (71.5% to 92.7%; held constant 63.5%; p=0.3775), although the corresponding survey-year trends were not statistically significant. In WPRO, the extrapolated quit ratio declined slightly from 24.2% in 2024 to 20.7% in 2050, compared with a held-constant estimate of 24.6%, again without statistical evidence of a temporal trend (p=0.6907). Projected values and year-trend estimates are presented in Supplementary file Table S3, while model diagnostics relevant to the temporal specifications and interpretation of the extrapolations are summarized in Supplementary file Table S5. Because these estimates extend observed logit-linear relationships beyond the 2012–2023 observation period, and because several underlying year trends were statistically weak, they are presented as illustrative extrapolations rather than forecasts.
Framework summary
Supplementary file Figure S2 maps the survey-weighted findings above back onto Levesque’s five access dimensions, bringing together the strongest result from each domain in a single view: a diagnosed cardiometabolic condition under the ability to perceive domain, sparse and inconsistent quit-attempt reporting under ability to seek, a stronger national tobacco-control policy environment under ability to reach, the Africa-only data restriction under ability to pay, and the demographic and regional pattern of who ultimately succeeds in quitting under ability to engage.
DISCUSSION
In this secondary analysis of pooled WHO STEPS surveys, smoking cessation varied substantially across the five WHO regions and across demographic, socioeconomic, and behavioral groups. The overall survey-weighted quit ratio was 31.1%, ranging from 25.0% in WPRO to 63.2% in PAHO. In the pooled survey-weighted model, older age, female sex, tertiary education, current marriage, and diagnosed hypertension were associated with higher odds of cessation, whereas harmful alcohol use and insufficient physical activity were associated with lower odds. There was no evidence of an overall pooled survey-year association, although region-specific analyses identified a positive temporal association in AFRO and a negative association in EMRO; within the African policy subset, middle and high tobacco-control policy-score categories were associated with higher odds of cessation than the low category.
Viewed through Levesque’s framework, three findings are most informative. Within the ability-to-perceive domain, diagnosed hypertension and harmful alcohol use showed contrasting associations with successful cessation6. Diagnosed hypertension was associated with higher odds of cessation in the pooled analysis, whereas harmful alcohol use showed the largest observed inverse association with cessation. One possible interpretation is that a previous hypertension diagnosis may coincide with greater awareness of cardiovascular risk or contact with health services, while harmful alcohol use may identify smokers with co-occurring behavioral risks that make cessation more difficult23. However, the cross-sectional design does not permit determination of whether either exposure preceded or contributed causally to smoking cessation.
The region-specific models also indicated substantial heterogeneity in the association between survey year and cessation. In the fully adjusted models, survey year was positively associated with cessation in AFRO and negatively associated with cessation in EMRO, whereas no statistically significant survey-year associations were observed in EURO, PAHO, or WPRO. These findings indicate that the pooled survey-year coefficient does not adequately summarize the observed regional patterns. However, because the contributing surveys are repeated cross-sectional observations rather than longitudinal follow-up of the same populations, these coefficients should not be interpreted as direct evidence that cessation increased or decreased over time within individual countries or individuals24,25. Changes in the composition of countries, survey populations, measurement, or other unmeasured contextual factors across survey rounds may also contribute to the observed associations. The regional patterns are broadly consistent with previous evidence showing substantial variation in tobacco use and cessation across countries and population groups. Nevertheless, direct comparison of coefficient magnitudes between WHO regions should remain cautious because the regional models were fitted independently and no formal region-by-year interaction test was performed. This is particularly important for PAHO, where the small complete-case sample and wide confidence intervals limit the precision of the regional estimates. The temporal findings also require qualification with respect to functional form25. Diagnostic testing suggested that the survey-year association was not adequately represented by a strictly linear logit-scale relationship in the pooled and AFRO models. Accordingly, the reported linear AORs for these models should be viewed as summaries of the average association across the observed 2012–2023 period rather than as evidence of a constant rate of temporal change. This limitation is particularly relevant to the illustrative extrapolations, which deliberately extend a simple logit-linear specification beyond the observed period.
Within the African subset, middle and high tobacco-control policy-score categories were associated with higher odds of cessation relative to the low category after adjustment for individual-level characteristics and survey year26. This differed from the direction observed in the earlier unweighted analysis. The change in estimates after incorporating the STEPS sampling weights, clustering, and stratification suggests that differences in the representation of countries and population groups across pooled survey rounds may have influenced the unweighted association. However, because policy exposure was measured at the country level and the underlying surveys were cross-sectional, the observed associations cannot establish that stronger tobacco-control policies caused higher cessation26. Rather, the findings support further evaluation of the relationship between national tobacco-control environments and cessation using longitudinal or repeated-survey designs and, where possible, disaggregated policy measures.
The extrapolation analysis illustrates the uncertainty involved in extending observed cross-sectional survey-year patterns beyond the period of data collection. The logit-linear and held-constant scenarios diverged substantially, particularly in some WHO regions27. The simple extrapolation models do not account for potential ceiling effects, future tobacco-control policy changes, economic conditions, smoking initiation, relapse, or changes in the composition of surveyed populations. In addition, the direction and statistical strength of temporal associations differed between the simple year-only extrapolation models and some fully adjusted regional models. The extrapolated values should therefore be interpreted as illustrations of the consequences of extending a specified logit-linear relationship, rather than as estimates of the future quit ratio or evidence that the projected trajectories will occur.
Policy implications
Several implications may be considered in light of these findings. Within the ability-to-perceive domain, the association between diagnosed hypertension and higher odds of cessation highlights the potential value of evaluating opportunities to integrate smoking-cessation assessment and support within routine management of diagnosed cardiovascular risk28. Conversely, the strong association between harmful alcohol use and lower odds of cessation suggests that smokers with co-occurring alcohol-related risk may represent an important population for evaluating integrated behavioral interventions. Within the ability-to-seek domain, the limited availability of a standardized quit-attempt measure across STEPS surveys highlights the value of more consistent measurement of active cessation behavior in future survey rounds. Within the ability-to-reach and ability-to-pay domains, the observed association between higher tobacco-control policy-score categories and greater odds of cessation in the African subset supports further evaluation of how specific policy components, including taxation, price, marketing restrictions, and availability measures, relate to cessation29. Finally, the contrasting survey-year associations observed in AFRO and EMRO may warrant further investigation using repeated surveys and country-specific analyses to determine whether these patterns persist and what contextual factors may contribute to them.
Strengths and limitations
This study has several important strengths. It draws on a large pooled sample of adult ever smokers from nationally implemented WHO STEPS surveys across five WHO regions, allowing smoking cessation to be examined across diverse demographic, socioeconomic, behavioral, and health-system contexts3. The analysis distinguishes the descriptive quit ratio from the individual-level regression outcome and incorporates the complex survey design through sampling weights, clustering, and stratification. Predictor selection was guided a priori by epidemiological relevance and the Levesque Access to Health Care framework rather than by data-driven significance testing, while region-specific models and the Africa-specific policy analysis provided additional insight into heterogeneity that would be obscured in a pooled analysis alone9. Model diagnostics, including multicollinearity, functional-form, convergence, and separation checks, further strengthened assessment of model adequacy.
Several limitations should also be considered. The analysis was restricted to surveys conducted from 2012 onward because earlier surveys in the pooled file showed implausible quit ratios, although some residual heterogeneity in smoking-status measurement may remain across later survey rounds. Because the contributing surveys were cross-sectional, temporal ordering cannot be established and the observed associations should not be interpreted as causal effects30. The quit ratio is not a longitudinal measure of cessation and may be affected by survivorship bias; quit-attempt data were sparsely available, product-specific tobacco information was unavailable, and diagnosed hypertension and diabetes may have misclassified participants with undiagnosed disease. Region-specific models were fitted independently, the PAHO model was based on a small sample with imprecise estimates, and tobacco-control policy data were limited to African countries. Finally, the 2024–2050 projections are illustrative extrapolations rather than validated forecasts, and residual confounding from unmeasured health-system, tobacco-industry, and household-level factors remains possible.
CONCLUSIONS
In pooled cross-sectional WHO STEPS surveys conducted between 2012 and 2023, smoking cessation varied substantially across five WHO regions and across demographic, socioeconomic, behavioral, and health-related characteristics. The descriptive analysis included 54460 ever smokers from 59 countries, while the survey-weighted multivariable analysis included 17332 ever smokers from 45 countries. Older age, female sex, tertiary education, current marriage, and diagnosed hypertension were associated with higher odds of successful cessation, whereas harmful alcohol use and insufficient physical activity were associated with lower odds. There was no evidence of an overall pooled survey-year association after accounting for the complex survey design, although positive and negative temporal associations were observed in AFRO and EMRO, respectively. Within the African policy subset, middle and high tobacco-control policy-score categories were associated with higher odds of cessation relative to the low category. Because these findings are derived from cross-sectional surveys, they should not be interpreted as evidence of causal effects. The substantial regional heterogeneity and limited availability of consistent quit-attempt measures highlight the value of continued standardization of cessation surveillance and further longitudinal or repeated-survey evaluation of context-specific tobacco-control and cessation strategies.