


INTRODUCTION
Lung cancer remains the leading cause of cancer death in the United States despite sustained reductions in mortality associated with declining smoking prevalence, earlier detection, and treatment advances1. These gains do not necessarily extend equally to patients with substantial chronic respiratory disease. Chronic lower respiratory diseases (CLRD), particularly chronic obstructive pulmonary disease, frequently coexist with lung cancer because of shared tobacco exposure, age, and pulmonary susceptibility2. Reduced respiratory reserve can also narrow treatment options and is associated with clinically distinct patterns of comorbidity and survival3.
National mortality studies have begun to characterize this overlap. Grobman et al.4 evaluated lung cancer deaths among people with CLRD through 2020 and identified persistent demographic and rural disparities. More recently, Faheem et al.5 examined lung cancer and chronic obstructive pulmonary disease among adults aged ≥65 years through 2024, defining either condition in underlying or contributing cause fields. Related work by Didier et al.6 documented broader demographic disparities in US lung cancer mortality through 2020. These studies establish the importance of the topic, but their broader co-occurrence definitions do not isolate deaths in which lung cancer was certified as the initiating cause and chronic respiratory disease was documented as part of the fatal clinical context.
That distinction matters. A directional definition can describe a specific mortality phenotype rather than a general set of records in which two diagnoses appear anywhere on the death certificate. It also permits a clinically interpretable denominator: all deaths with lung cancer as the underlying cause. The resulting proportion indicates how much of lung cancer mortality is documented in the context of CLRD, even when the population mortality rate is falling.
We therefore examined temporal patterns in lung cancer mortality with co-reported CLRD among US adults aged ≥65 years from 1999 through 2024. The aim of this study was to characterize national, demographic, geographical, and age-specific trends and to quantify the contribution of this phenotype to all deaths in which lung cancer was the underlying cause. We hypothesized that mortality in this subgroup would decline more slowly than overall lung cancer mortality and would account for an increasing share of lung cancer deaths over time.
METHODS
Study design and data source
We conducted a serial cross-sectional secondary analysis using the Centers for Disease Control and Prevention Wide-ranging Online Data for Epidemiologic Research (CDC WONDER) Multiple Cause of Death database7. The database compiles registered death certificates from all 50 states and the District of Columbia and provides underlying and contributing causes of death with demographic and geographical characteristics. Annual records from 1999 through 2024 were evaluated. Data for 1999–2020 were taken from the 1999–2020 Multiple Cause of Death module, and data for 2021–2024 were taken from the 2018–2024 single-race module. For the overlapping years 2018–2020, only values from the 1999–2020 module were retained; values from the newer module were neither incorporated into the analytic series nor formally compared for concordance. The same underlying- and contributing-cause definitions were applied across modules.
The analysis used publicly available, de-identified, aggregate data. Institutional review board approval and informed consent were not required. Reporting was guided by the Strengthening the Reporting of Observational Studies in Epidemiology statement8.
Case definition
Lung cancer mortality was defined by an underlying cause of death code C34, malignant neoplasm of bronchus and lung, from the International Classification of Diseases, Tenth Revision (ICD-10)9. For this study, CLRD was operationally defined using ICD-10 codes J40-J47: bronchitis not specified as acute or chronic (J40), simple and mucopurulent chronic bronchitis (J41), unspecified chronic bronchitis (J42), emphysema (J43), other chronic obstructive pulmonary disease (J44), asthma (J45), status asthmaticus (J46), and bronchiectasis (J47). This reproducible ICD-10 grouping was used consistently across the study period but does not encompass every chronic pulmonary condition, including interstitial lung diseases. The complete code set is provided in Supplementary file Table S1.
The primary phenotype therefore required lung cancer to be the underlying cause and CLRD to be a contributing cause. This directional definition does not establish when CLRD developed, its clinical severity, or whether it directly accelerated death. It should be interpreted as a co-reported mortality phenotype rather than a causal relationship.
Variables and outcome measures
Analyses were stratified by sex, race and ethnicity, US Census region, age group, and area of residence. Race and ethnicity were summarized into five harmonized categories: Hispanic or Latino, non-Hispanic White, non-Hispanic Black or African American, non-Hispanic American Indian or Alaska Native, and non-Hispanic Asian or Pacific Islander. For cross-module consistency, race/ethnicity results were restricted to these five prespecified harmonized categories. Together they accounted for 489962 phenotype deaths; the remaining 940 deaths (0.19%) fell outside the five reported strata and were retained in overall analyses7. Census regions were Northeast, Midwest, South, and West. Age groups were 65–74, 75–84, and ≥85 years. Area of residence was classified as metropolitan or non-metropolitan using the National Center for Health Statistics county classification scheme10. These analyses ended in 2020 because a comparable urbanization variable was not available in the newer mortality module.
Age-adjusted mortality rates (AAMRs) per 100000 population, with 95% confidence intervals (CIs) and standard errors, were used for the overall, sex, race and ethnicity, regional, and residence analyses. Rates were standardized to the 2000 US population11. Crude mortality rates were used for predefined age groups.
Two composition measures were prespecified. First, annual deaths in the primary phenotype were divided by all deaths for which C34 was the underlying cause among adults aged ≥65 years. Second, cumulative phenotype deaths were divided by cumulative overall lung cancer deaths across 1999–2024. Because the phenotype is contained within the overall lung cancer denominator, these measures describe contribution rather than independent risk.
Statistical analysis
Because CDC WONDER provides aggregate mortality data rather than individual-level observations, patient-level continuous and categorical variables were not summarized and conventional between-group hypothesis tests were not performed. Descriptive measures included annual death counts, crude or age-adjusted mortality rates per 100000 population, and proportions. Annual rates and standard errors were evaluated using the National Cancer Institute Joinpoint Regression Program, version 5.1.012,13. Log-linear joinpoint models estimated annual percent change (APC) for individual temporal segments and average annual percent change (AAPC) across each full analytic period, with corresponding 95% CIs. Statistical significance was defined by a 95% CI that excluded zero, corresponding to a two-sided alpha level of 0.05. Segment estimates and full-period AAPCs are reported in Supplementary file Tables S2 and S3.
Suppressed cells were not imputed or treated as zero. Overall lung cancer mortality was defined with the same underlying cause code and age restriction, irrespective of whether CLRD was co-reported. The overall and phenotype series were described side by side, but no formal parallelism or coincidence test was performed. No multivariable regression or adjustment for potential confounders was performed because the available data were aggregate. Annual endpoint rates, death counts, and subgroup totals were reconciled against the supplied master and formatted analytic workbooks before manuscript preparation.
RESULTS
National trend and contribution to overall lung cancer mortality
From 1999 through 2024, 490902 deaths met the directional phenotype definition. The AAMR declined from 49.73 to 35.76 per 100000, corresponding to an average annual percent change of -1.34% (95% CI: -1.45 – -1.22). The rate showed no significant change during 1999–2006 and then declined during 2006–2024 (APC= -1.82%; 95% CI: -1.99 – -1.68) (Figure 1 and Table 1; and Supplementary file Tables S2 and S3, and Figure S1).
Figure 1
Annual age-adjusted mortality rates for lung cancer deaths with co-reported chronic lower respiratory diseases, overall and by sex, among US adults aged ≥65 years, a serial cross-sectional secondary analysis of the CDC WONDER Multiple Cause of Death database, United States, 1999–2024 (490902 phenotype deaths)
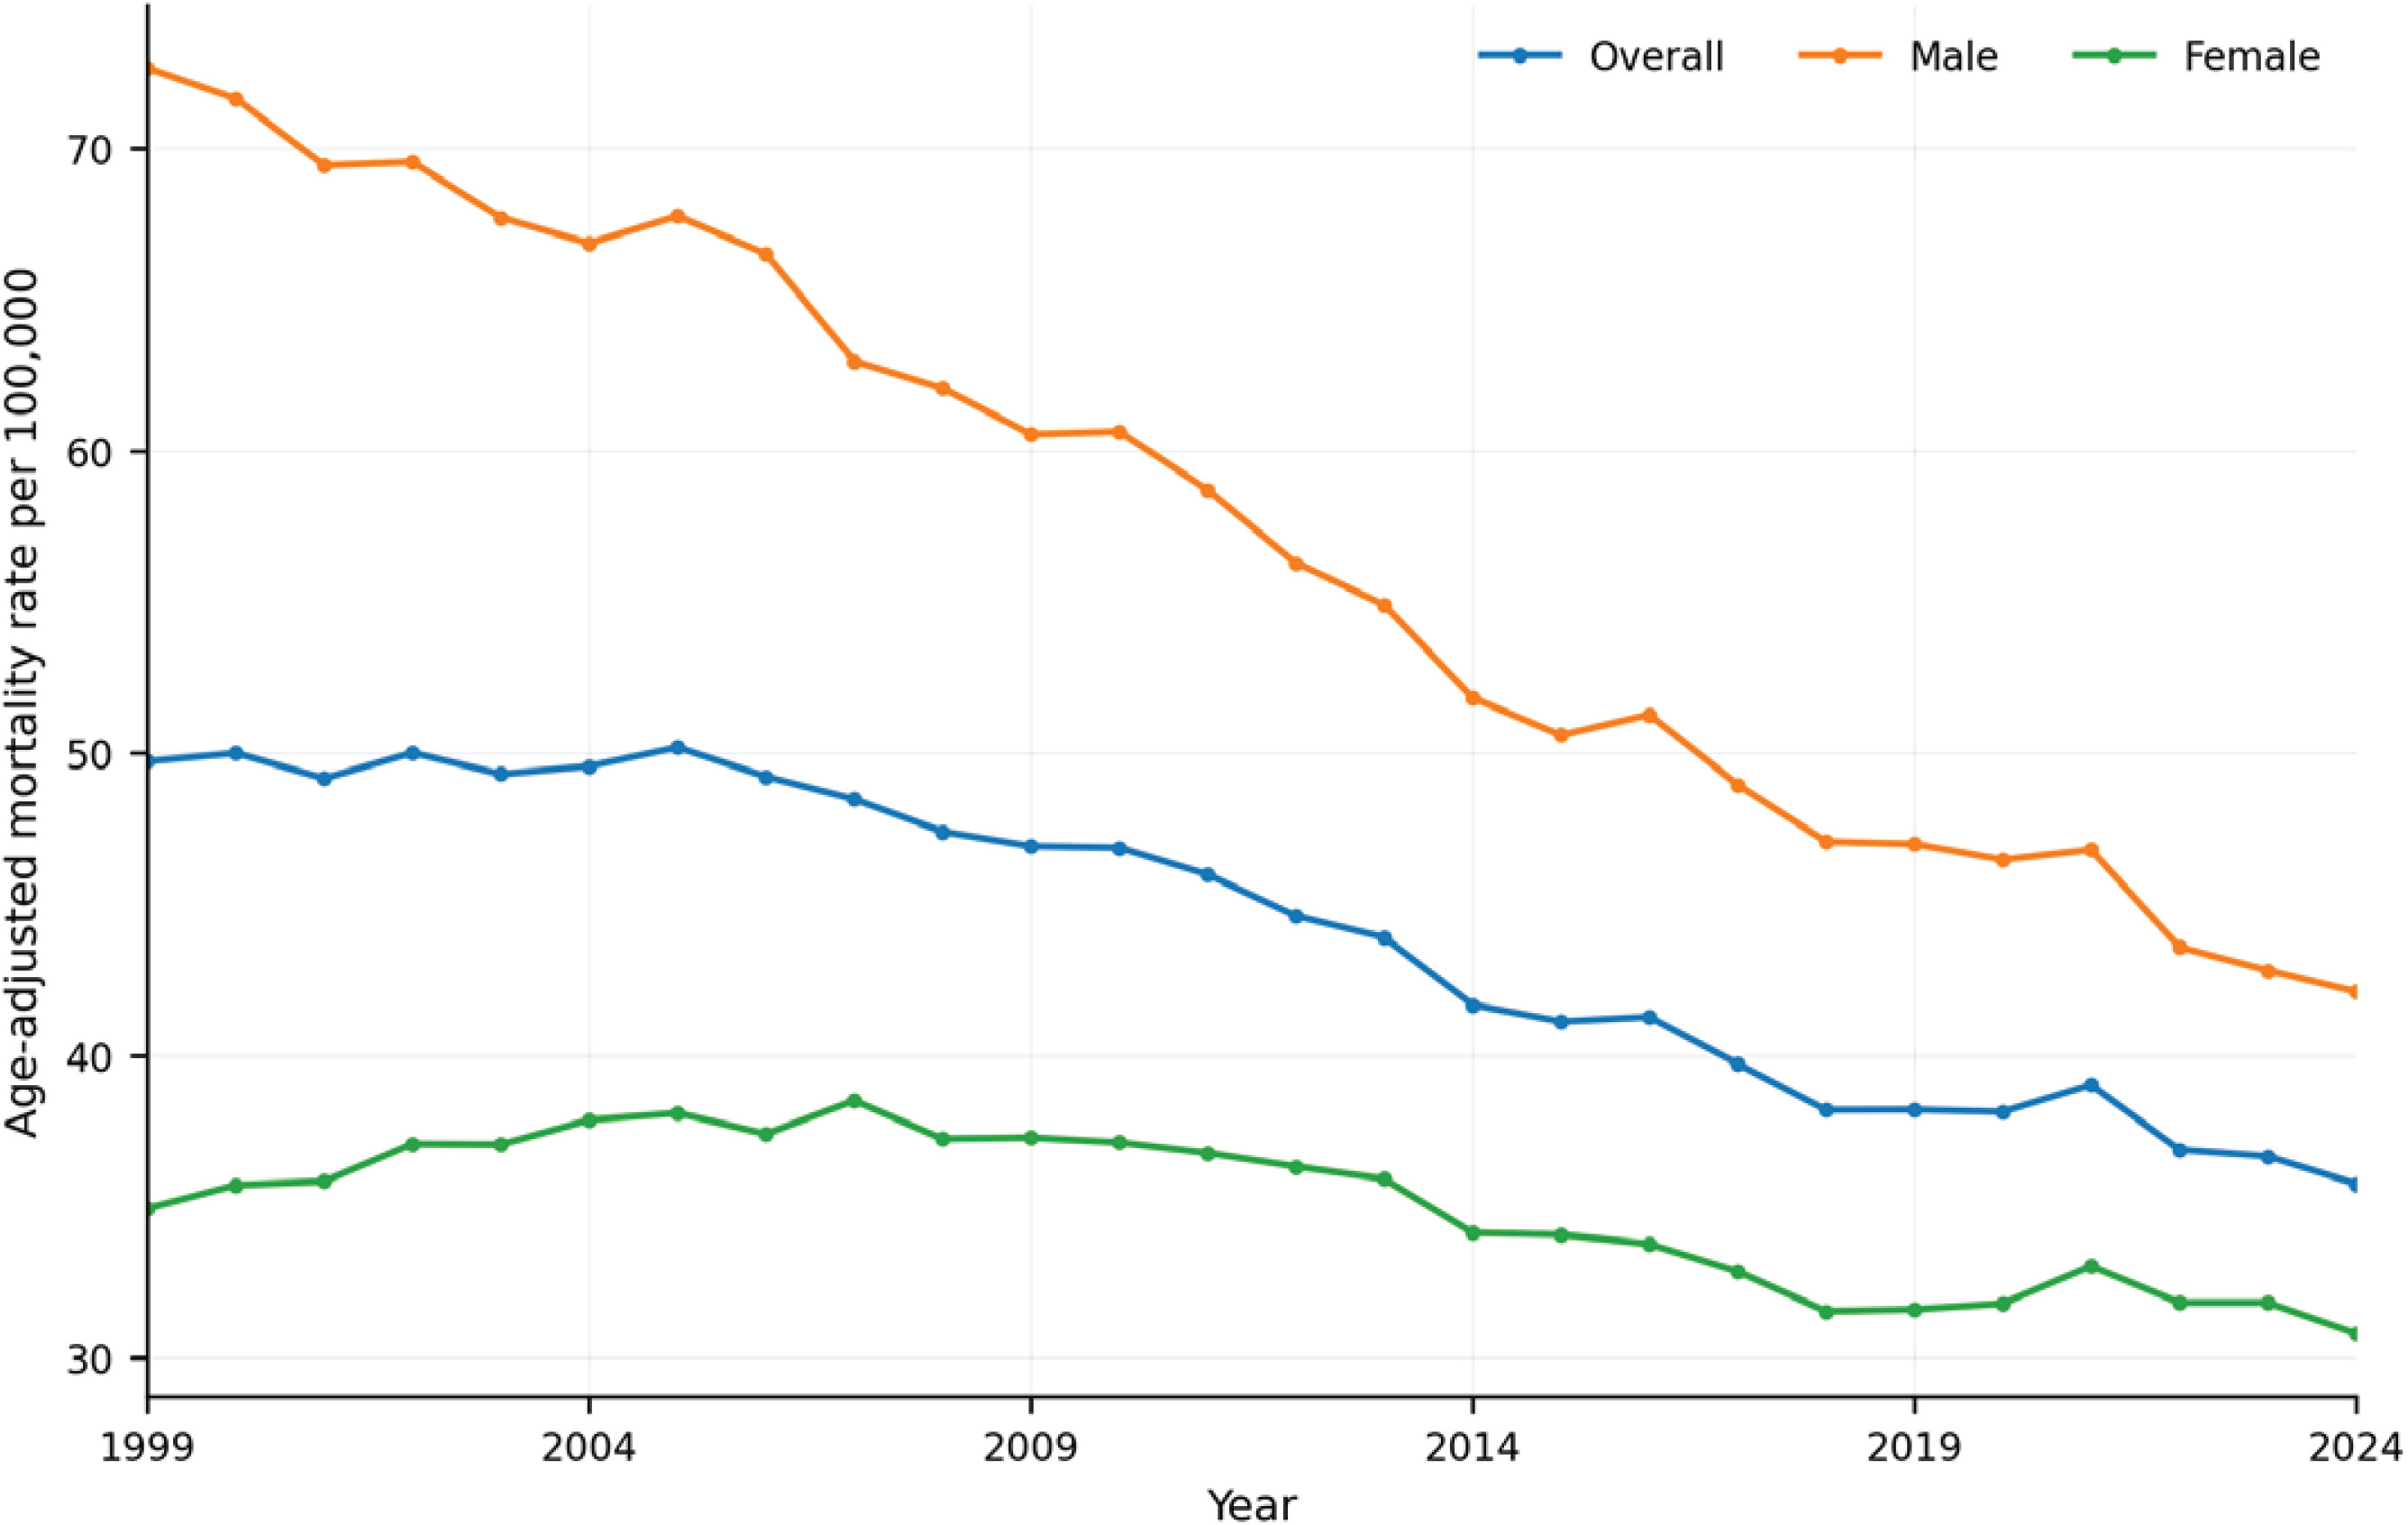
Table 1
Age-adjusted and crude mortality rates and long-term temporal trends for lung cancer mortality with co-reported chronic lower respiratory diseases among US adults aged ≥65 years, a serial cross-sectional secondary analysis of the CDC WONDER Multiple Cause of Death database, United States, 1999–2024 (primary phenotype N=490902; overall lung cancer comparator N=2850632)
[i] Rates are per 100000 population. Age-group rates are crude; all other rates are age adjusted. The primary phenotype included 490902 deaths; the overall lung cancer comparator included 2850632 deaths. The five prespecified harmonized race/ethnicity strata accounted for 489962 phenotype deaths; the remaining 940 deaths (0.19%) fell outside these five reported strata and were retained in the overall total. Urban-rural analyses ended in 2020. AAPC: average annual percent change. CI: confidence interval.
The age-adjusted decline did not translate into fewer annual deaths. The annual count increased from 17287 in 1999 to 20963 in 2024, a 21.3% increase. Over the same period, the phenotype share of all lung cancer deaths increased from 15.95% to 20.54%, a rise of 4.59 percentage points. Across the full study period, 17.22% of the 2850632 lung cancer deaths included a co-reported CLRD code (Table 2; and Supplementary file Table S4).
Table 2
Contribution of co-reported chronic lower respiratory diseases to all lung cancer deaths among US adults aged ≥65 years, a serial cross-sectional secondary analysis of the CDC WONDER Multiple Cause of Death database, United States, 1999–2024 (490902 phenotype deaths; 2850632 total lung cancer deaths)
[i] The phenotype required C34 as the underlying cause of death and at least one J40-J47 code among contributing causes. Across 1999–2024, the analysis included 490902 phenotype deaths and 2850632 total lung cancer deaths. The comparator includes phenotype deaths. AAMR: age-adjusted mortality rate. AAPC: average annual percent change.
Overall lung cancer mortality declined from 311.80 to 174.85 per 100000, with an AAPC of -2.30% (95% CI: -2.40 – -2.19). When indexed to 1999, the overall lung cancer series fell more rapidly than the CLRD phenotype, while the phenotype share increased (Supplementary file Figure S2). This comparison is descriptive because the phenotype is included within the overall lung cancer series and no formal between-trend test was performed.
Sex and racial and ethnic patterns
Mortality remained higher among males than females throughout the study period (Figure 1). Among males, the AAMR declined from 72.66 to 42.11 per 100000, with an AAPC of -2.16% (95% CI: -2.30 – -2.00). Among females, the rate declined from 34.95 to 30.81, with a smaller AAPC of -0.50% (95% CI: -0.60 – -0.39). The analysis included 267643 male and 223259 female deaths.
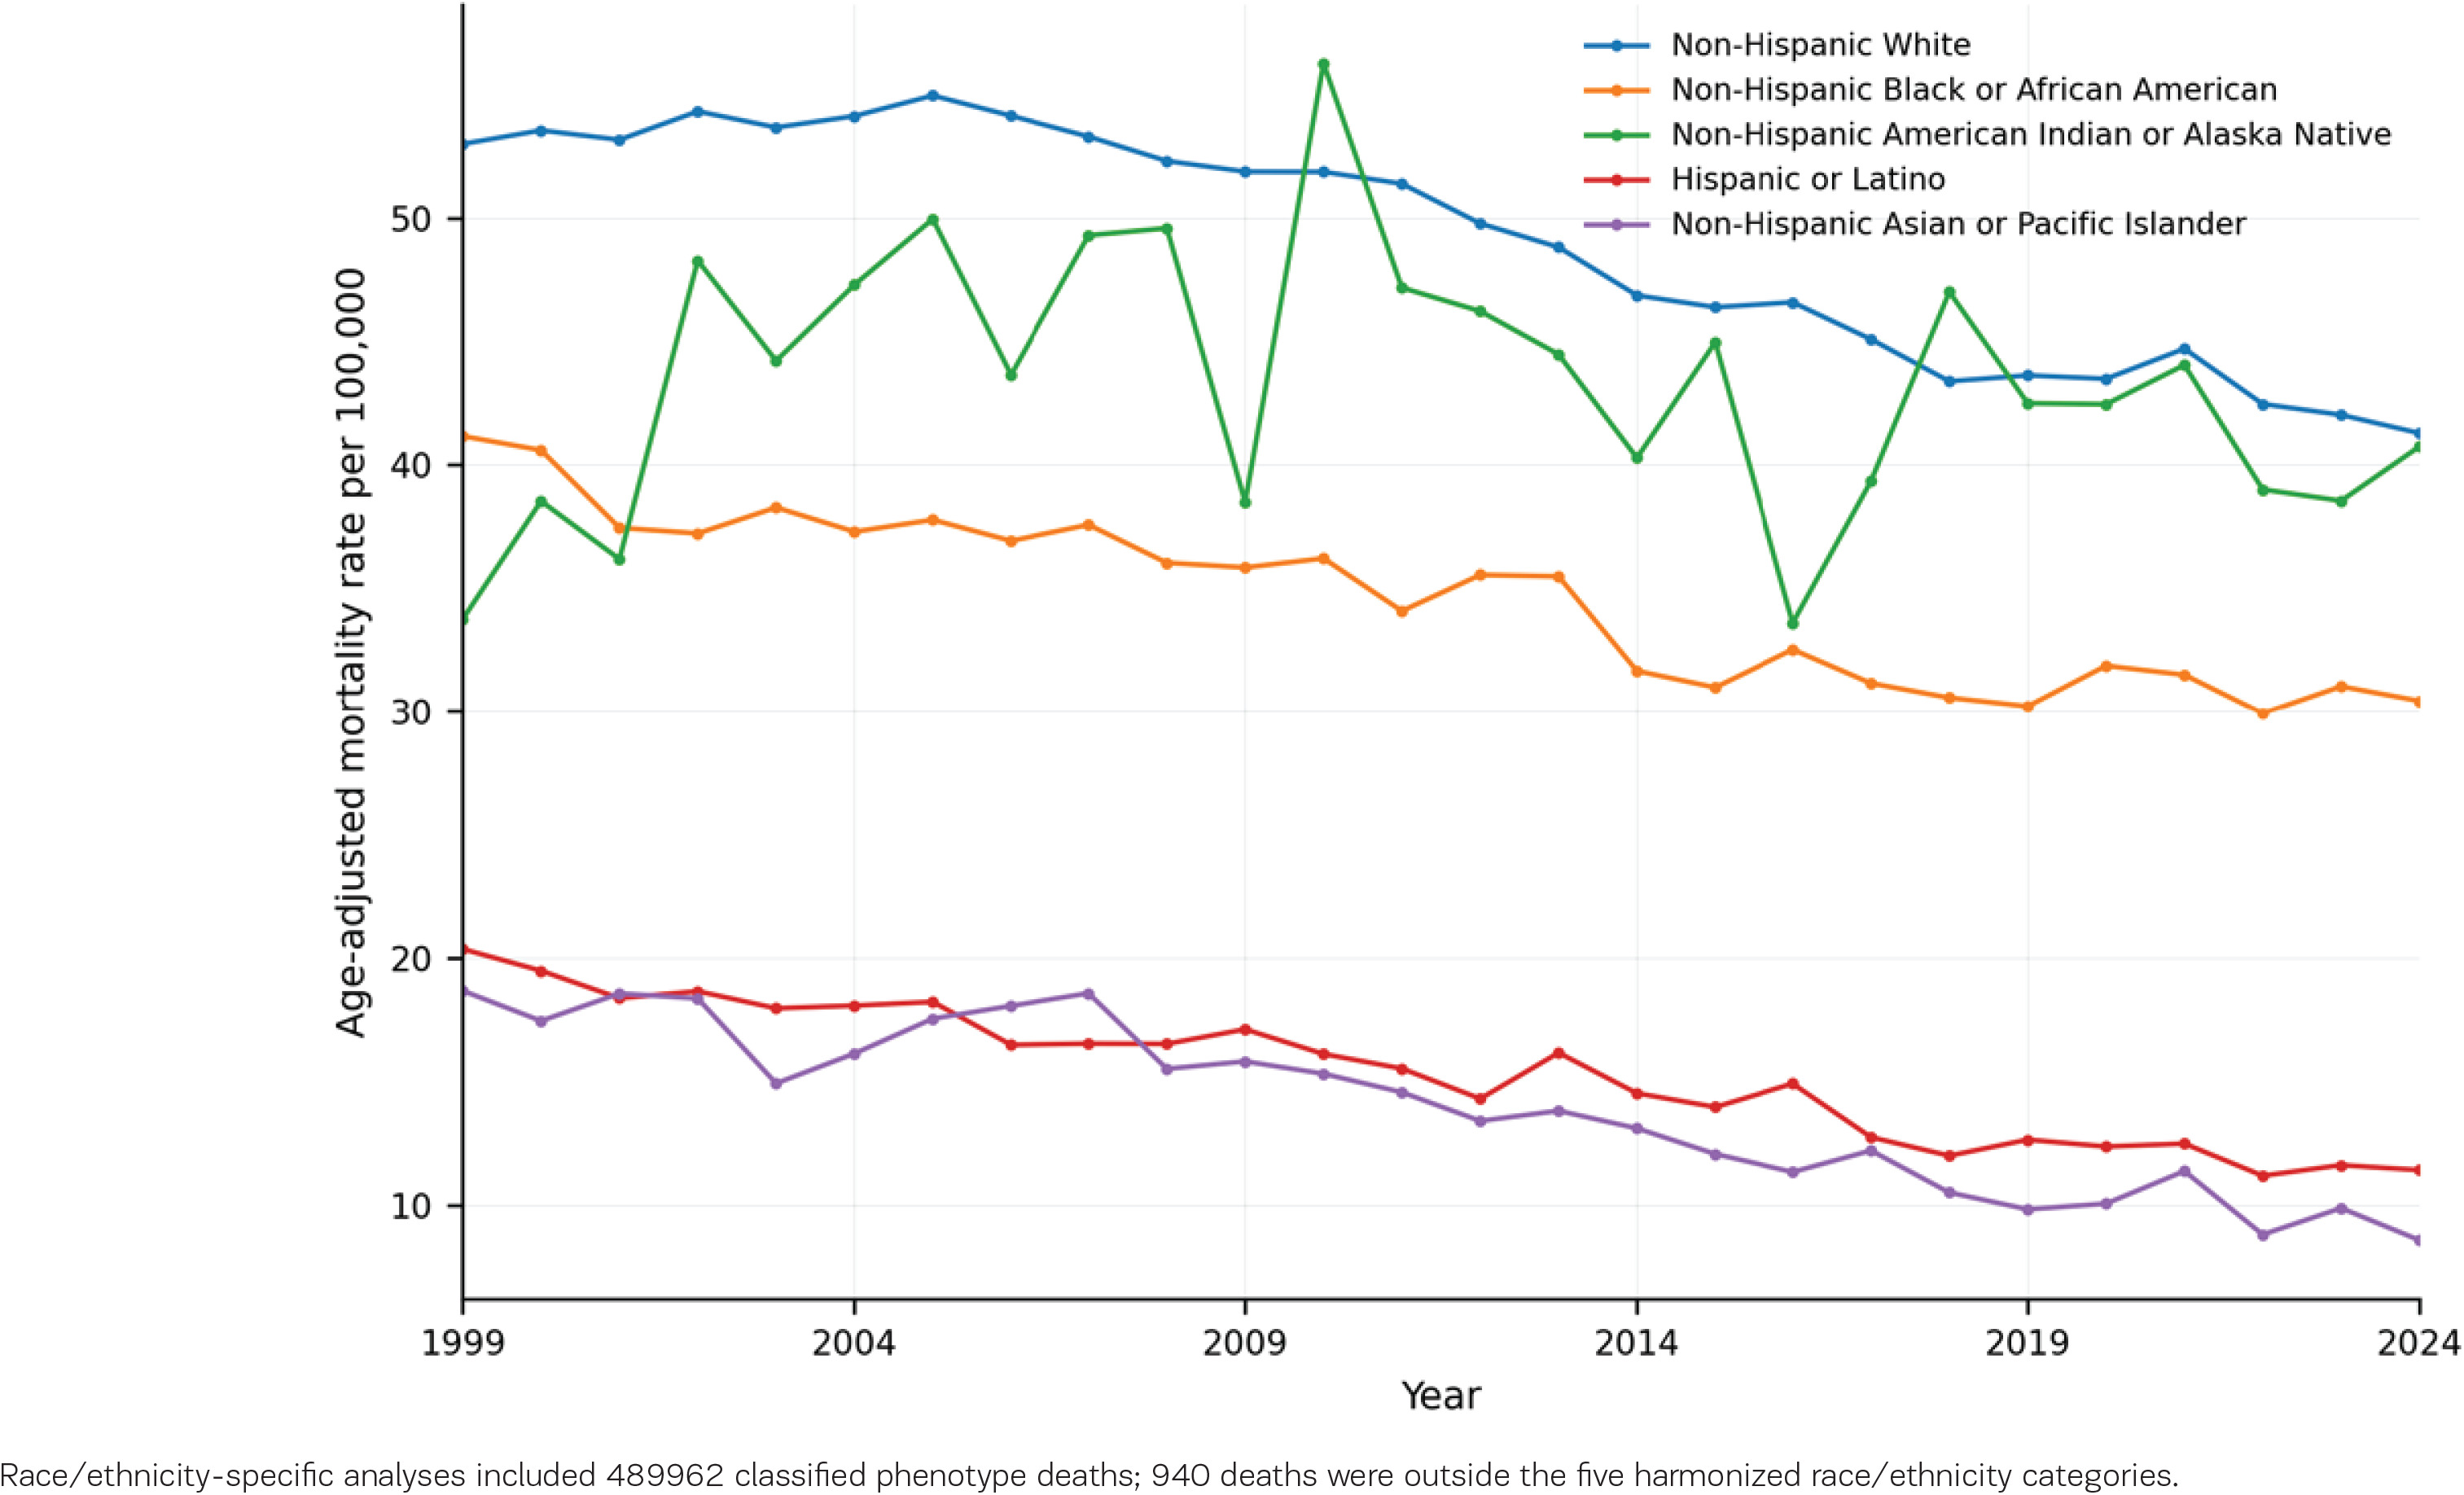
Long-term declines occurred among Hispanic or Latino, non-Hispanic White, non-Hispanic Black or African American, and non-Hispanic Asian or Pacific Islander adults (Figure 2). The largest estimated relative decline was among non-Hispanic Asian or Pacific Islander adults, whose AAMR fell from 18.67 to 8.57 per 100000. Non-Hispanic White adults had the highest cumulative number of deaths and an AAMR of 41.29 in 2024. Among non-Hispanic American Indian or Alaska Native adults, the AAMR was 33.76 in 1999 and 40.75 in 2024, and the full-period AAPC was not significant (0.53%; 95% CI : -0.45–1.90).
Geographical and age-specific patterns
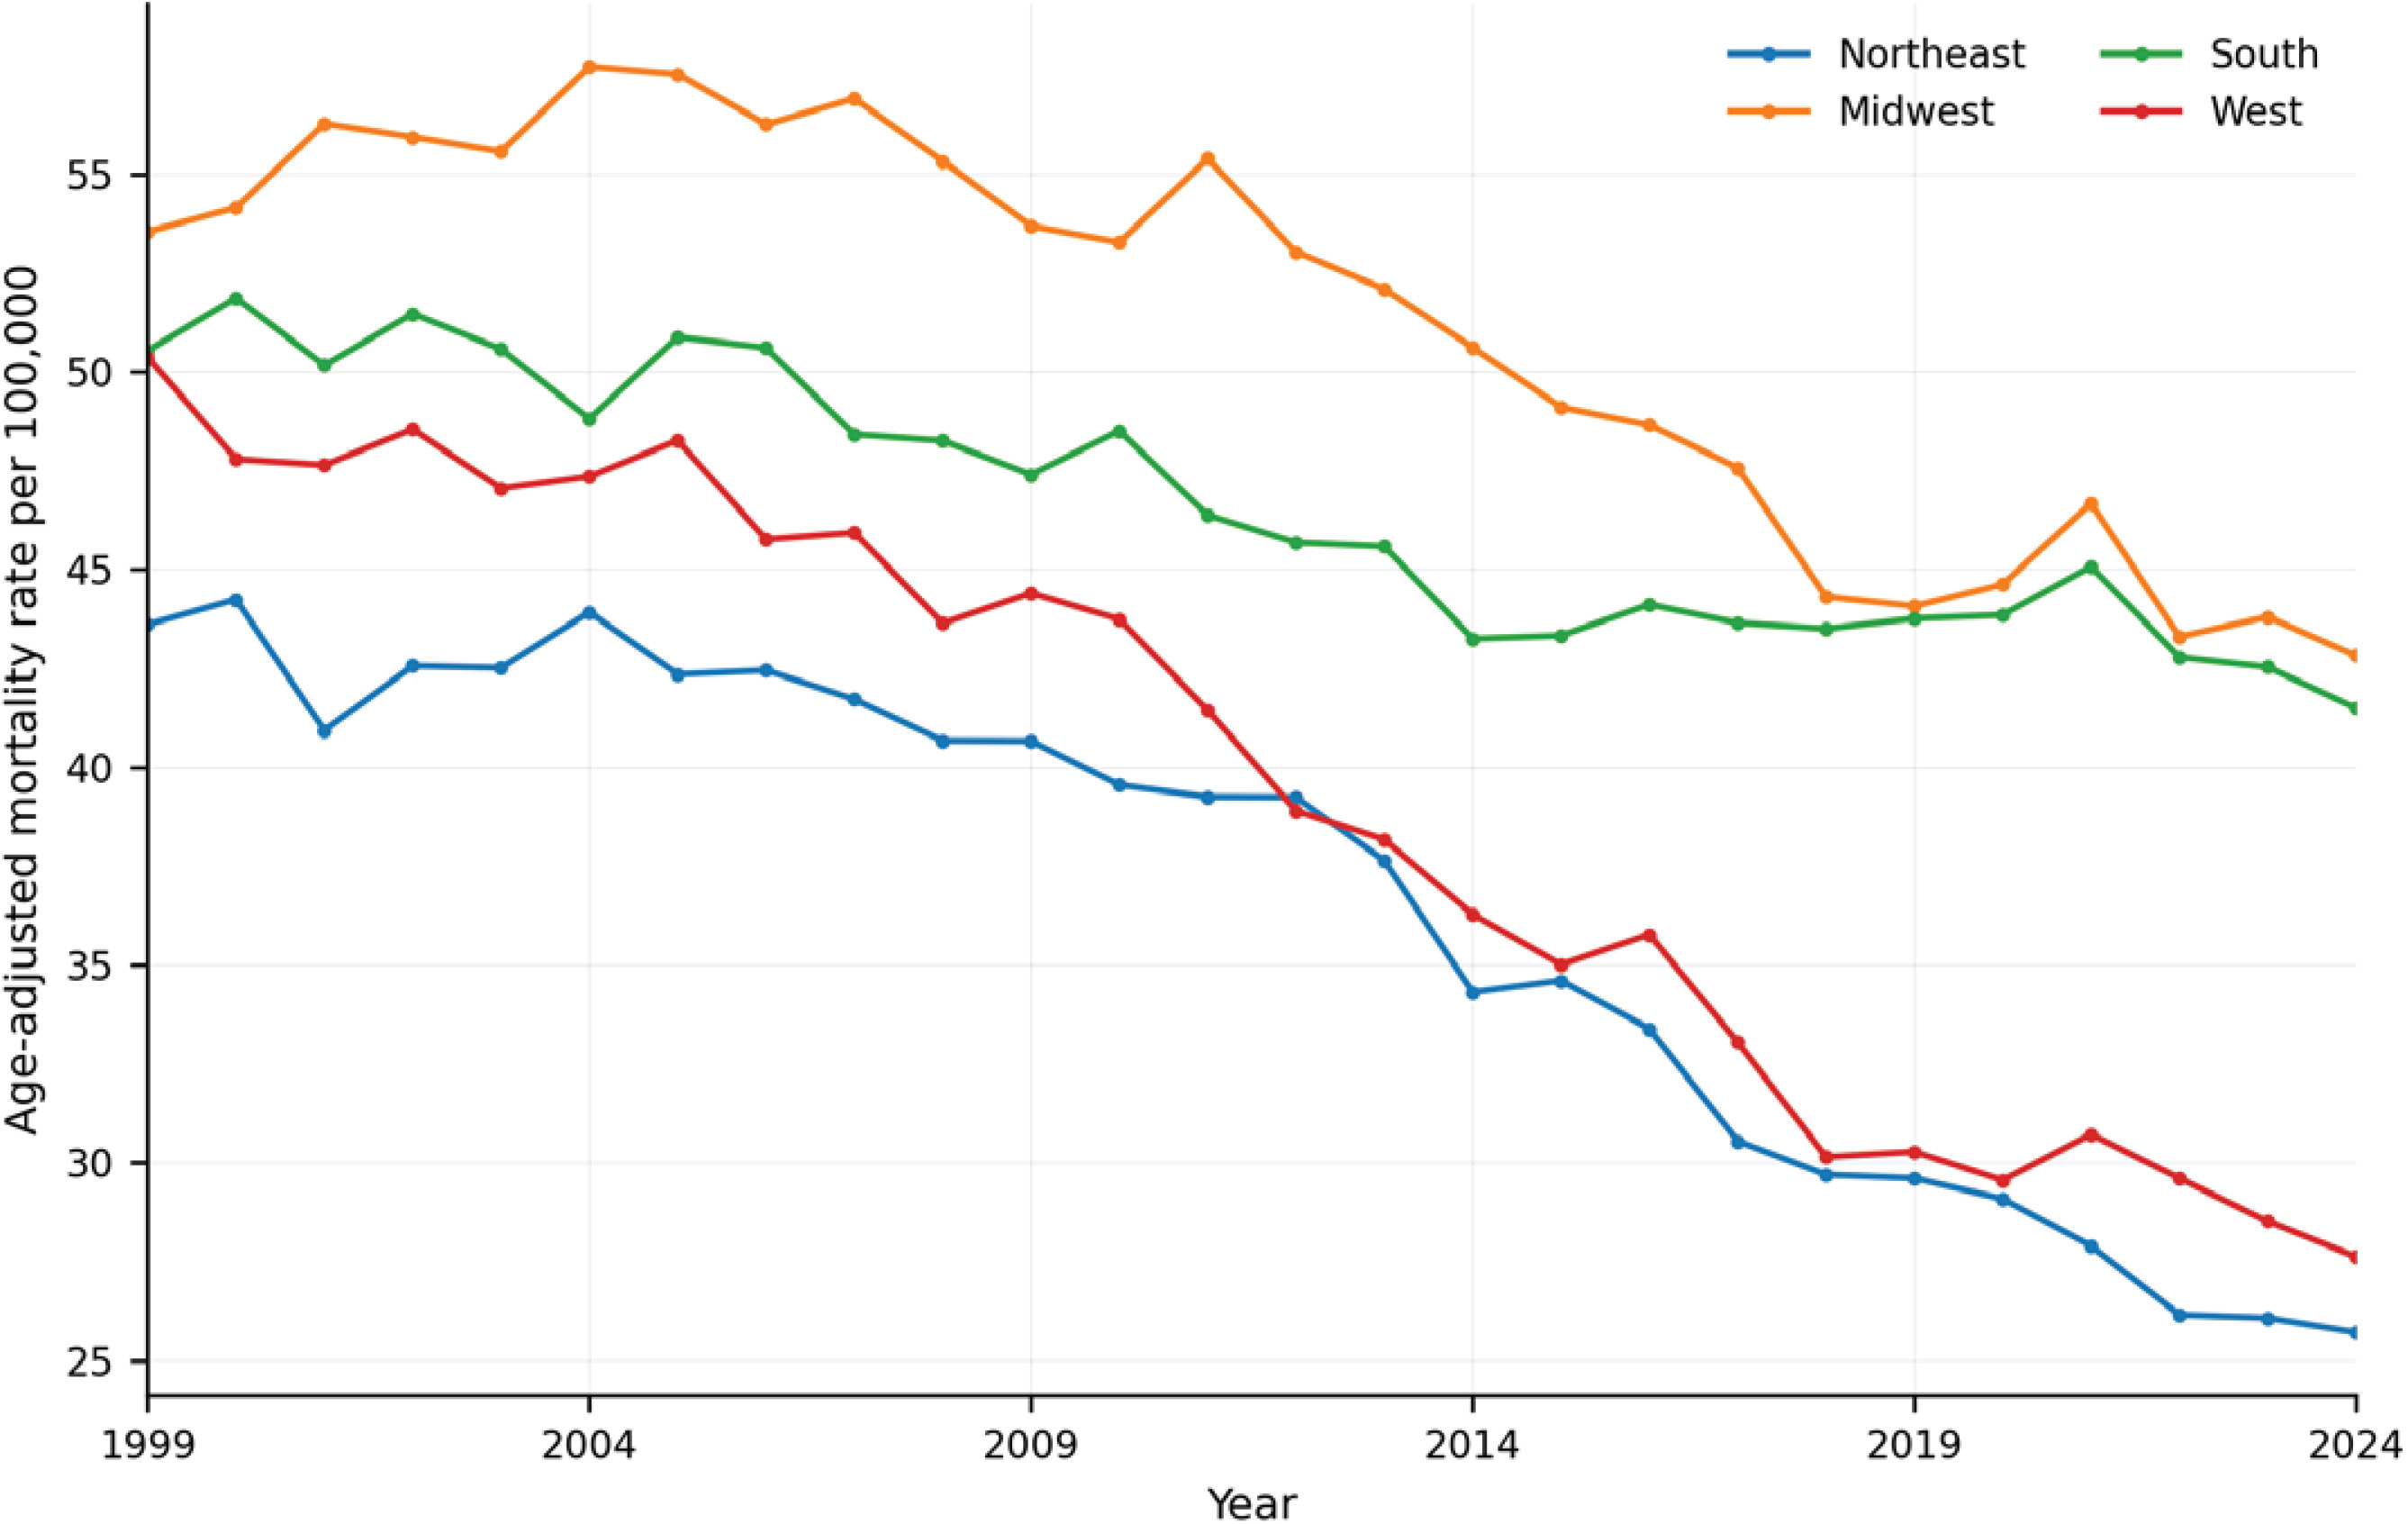
Mortality declined in all four Census regions, but the pace and residual burden differed (Figure 3). The Northeast and West had the largest long-term declines, with AAPC of -2.21% and -2.24%, respectively. Declines were slower in the Midwest (-0.94%) and South (-0.83%). In 2024, the AAMR remained highest in the Midwest at 42.82 per 100000, followed by the South at 41.50. The South contributed the largest cumulative number of deaths (194220).
Figure 3
Annual age-adjusted mortality rates for lung cancer deaths with co-reported chronic lower respiratory diseases by US Census region among US adults aged ≥65 years, a serial cross-sectional secondary analysis of the CDC WONDER Multiple Cause of Death database, United States, 1999–2024 (490902 phenotype deaths)
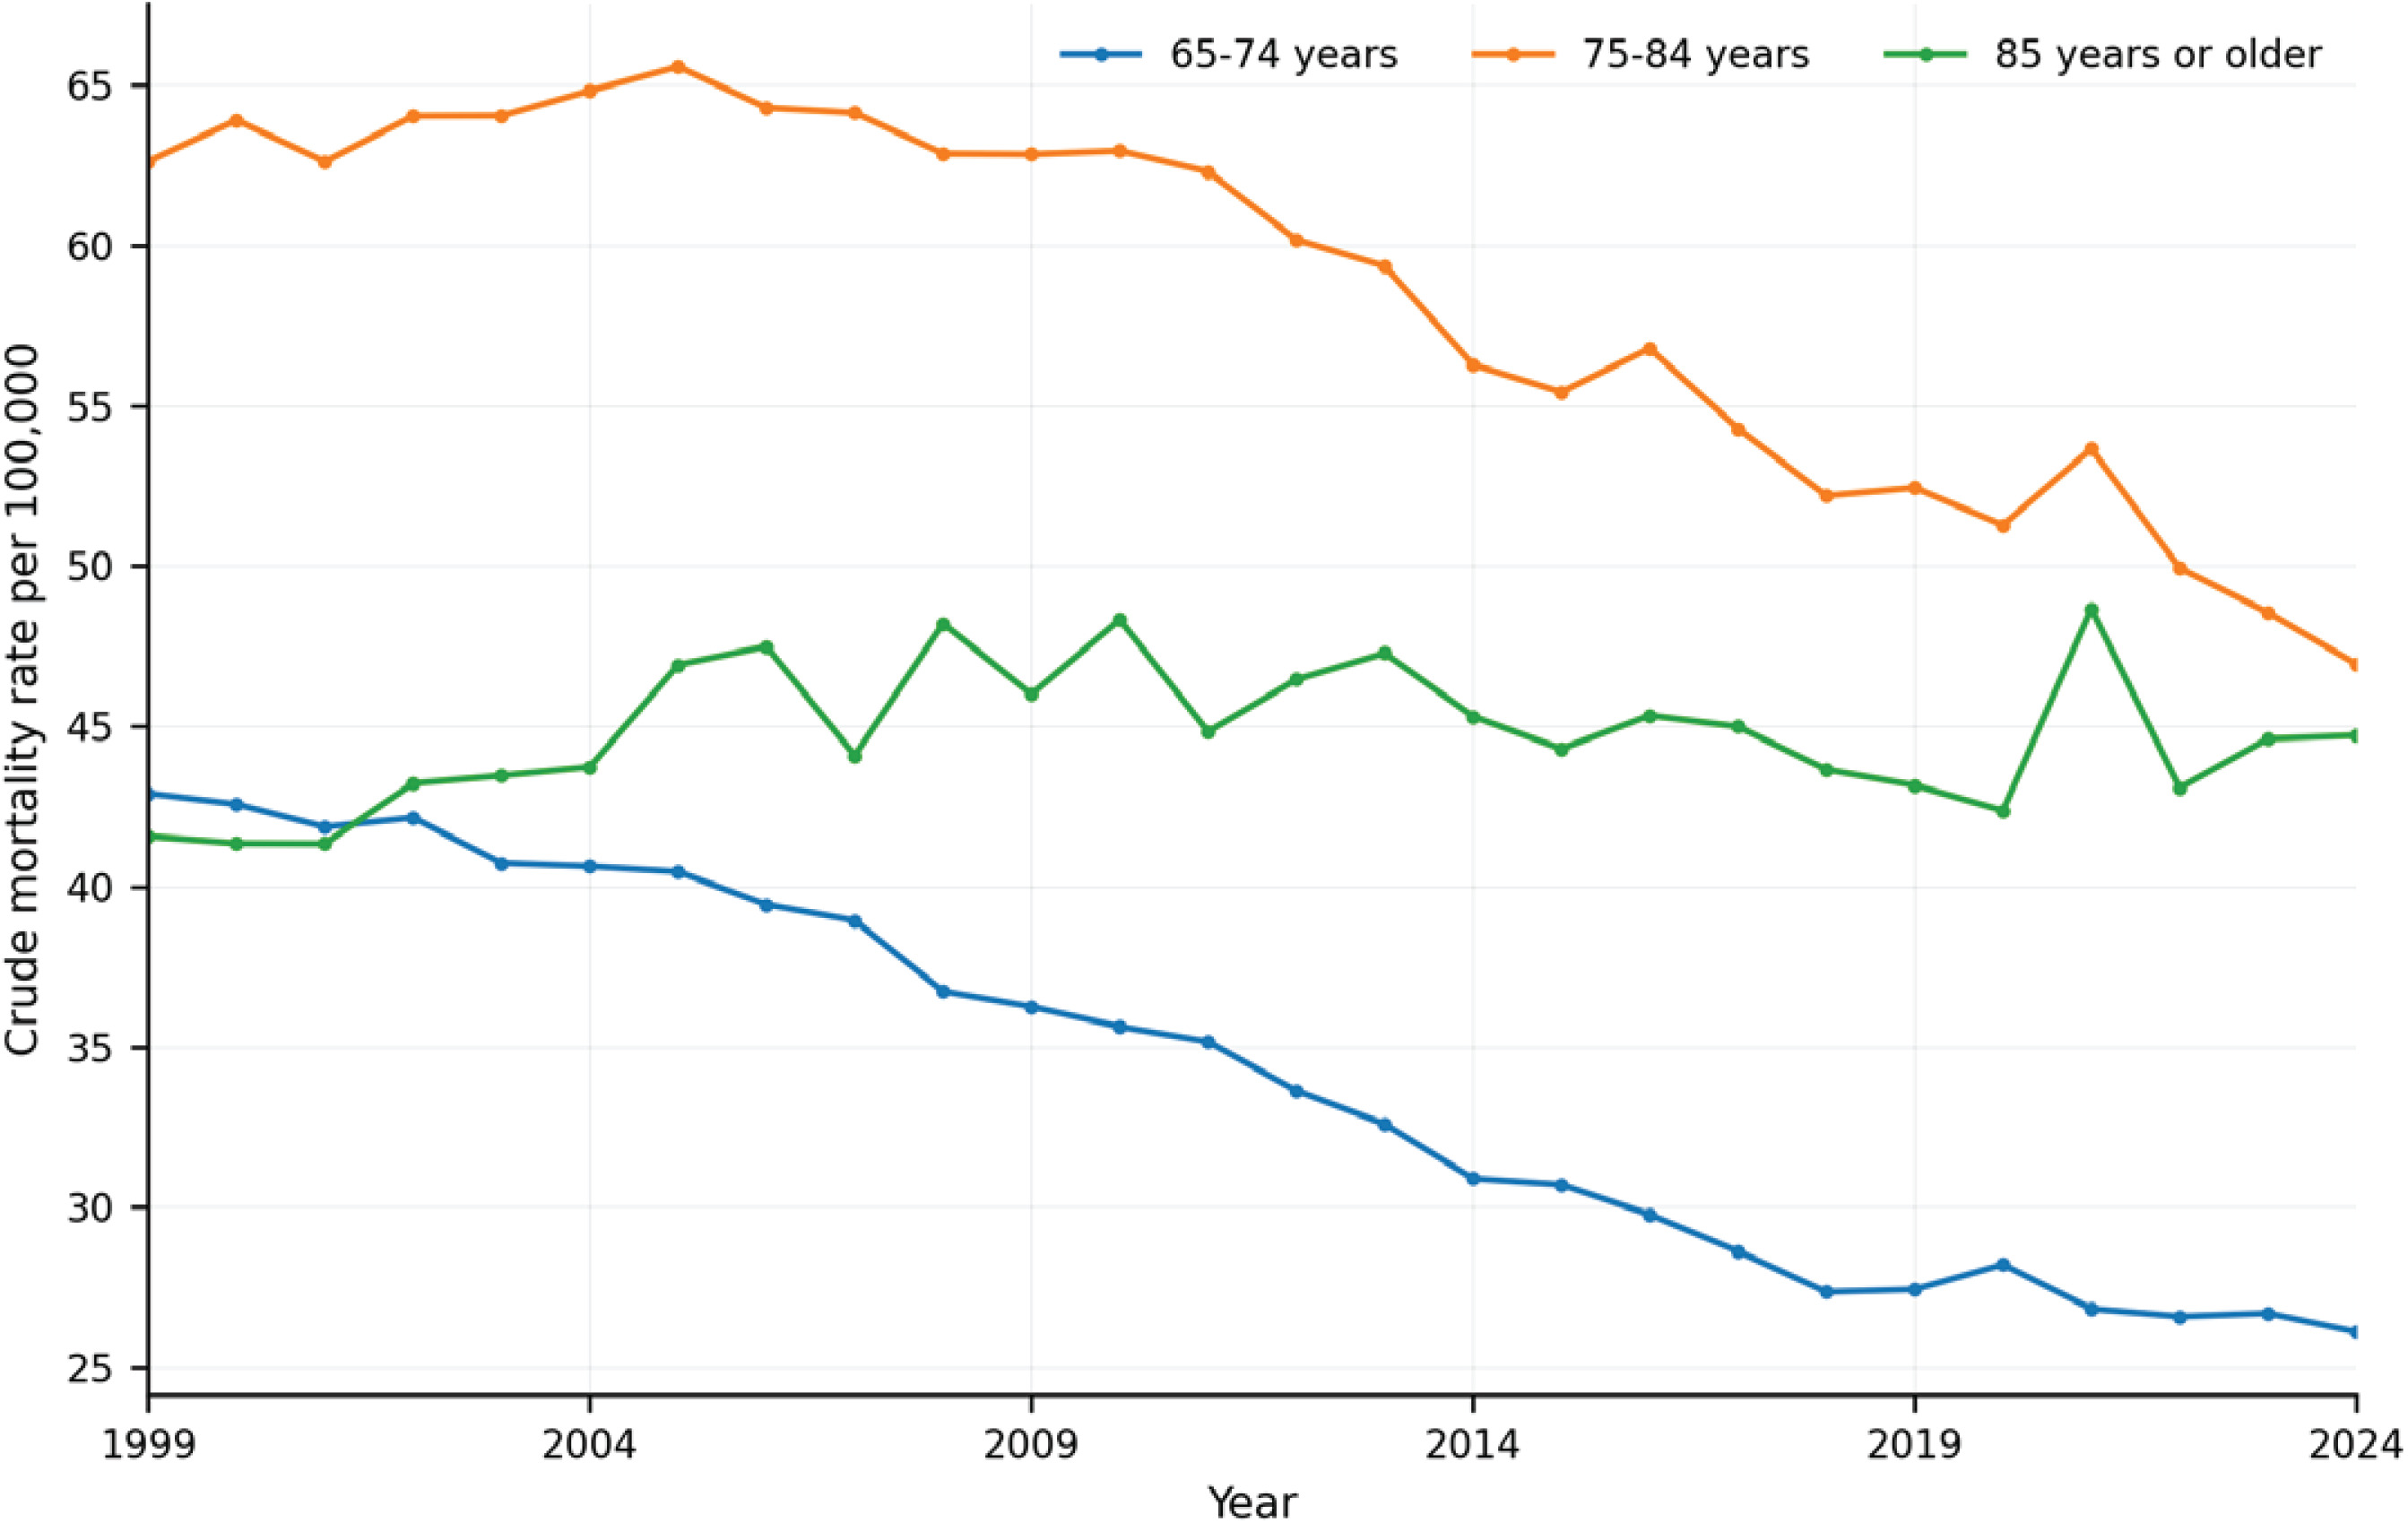
Age-specific rates declined among adults aged 65–74 years and 75–84 years (Figure 4). The crude mortality rate fell from 42.91 to 26.11 per 100000 among adults aged 65–74 years and from 62.63 to 46.94 among those aged 75–84 years. Adults aged ≥85 years showed no significant long-term change, with a rate of 41.57 in 1999 and 44.72 in 2024 and an AAPC of 0.33% (95% CI: -0.01–0.78).
Figure 4
Annual crude mortality rates for lung cancer deaths with co-reported chronic lower respiratory diseases by age group among US adults aged ≥65 years, a serial cross-sectional secondary analysis of the CDC WONDER Multiple Cause of Death database, United States, 1999–2024 (490902 phenotype deaths)
Area of residence patterns
Area of residence analyses were restricted to 1999–2020 (Supplementary file Figure S3). Metropolitan AAMRs declined from 48.39 to 34.80 per 100000, with an average annual percent change of -1.66% (95% CI: -1.80 – -1.50). Non-metropolitan rates declined only modestly, from 55.58 to 54.35, with an AAPC of -0.27% (95% CI: -0.43 – -0.07). Non-metropolitan rates were higher throughout the available period.
DISCUSSION
Principal findings
This national study identifies a divergence that is obscured when mortality rates are considered alone. Lung cancer mortality with co-reported CLRD declined after 2006, yet annual deaths increased and the phenotype grew from approximately one in six lung cancer deaths to more than one in five. Overall lung cancer mortality declined substantially faster. The result is a progressively larger documented respiratory component within fatal lung cancer among older adults.
The pattern was not uniform. Males retained higher rates, but females experienced a much slower decline. Non-Hispanic American Indian or Alaska Native adults and adults aged ≥85 years had no significant long-term reduction. The Midwest, South, and non-metropolitan areas also showed slower improvement and higher end-of-period burden. Together, these findings define a persistent mortality phenotype at the intersection of cancer, chronic respiratory disease, aging, and geography.
Interpreting a growing contribution despite falling rates
The central finding is the discordance among rate, count, and share. Age adjustment indicates that the population rate fell, whereas the annual number of deaths rose. Population aging can contribute to this difference because more adults are surviving into ages at which both lung cancer and CLRD are common. The increasing share further indicates that mortality within the co-reported CLRD subgroup declined less rapidly than lung cancer mortality overall.
This proportional increase should not be interpreted as evidence that CLRD caused a growing number of lung cancer deaths. Several mechanisms could produce the same death-certificate pattern. Older adults with smoking-related lung disease may survive longer before lung cancer develops, greater diagnostic recognition may increase contributing-cause documentation, or improvements in screening and treatment may have benefited people with preserved pulmonary reserve more than those with substantial respiratory impairment. The database cannot distinguish among these explanations.
Our findings complement, rather than replicate, two recent national analyses. The 1999–2020 study by Grobman et al.4 evaluated lung cancer deaths among people with CLRD across a broader adult population. The 1999–2024 analysis by Faheem et al.5 focused on chronic obstructive pulmonary disease and allowed lung cancer and COPD to appear in either underlying or contributing fields. The present analysis applies stricter directional field placement on the death certificate, uses the broader J40-J47 CLRD group, restricts all primary analyses to older adults, and quantifies the annual contribution to deaths for which lung cancer was the underlying cause. That compositional measure is the principal extension.
Demographic and geographical inequities
The sex pattern likely reflects historical smoking cohorts, but it may also involve differences in chronic respiratory phenotypes, competing mortality, screening, and treatment eligibility1,2. The higher male rate narrowed because the decline among males was more than four times the relative decline among females. Individual smoking history, pulmonary function, histology, stage, and treatment were unavailable, so these mechanisms remain hypotheses rather than tested explanations.
The absence of a significant long-term decline among non-Hispanic American Indian or Alaska Native adults warrants attention but requires careful interpretation. Death-certificate race classification is particularly vulnerable to misclassification in this population, and national averages can conceal large regional differences in smoking and lung cancer mortality14. The small cumulative count also produces wider uncertainty. Linked registry and tribal health data are needed before attributing the observed pattern to a specific exposure or care pathway.
The Midwest, South, and non-metropolitan findings are consistent with established geographical differences in lung cancer and CLRD mortality4,6,15. Tobacco exposure, occupational and environmental hazards, socioeconomic conditions, transportation, screening availability, pulmonary rehabilitation, and access to thoracic oncology may all contribute. None was measured here. The results identify where improvement has been slower, not why it has been slower.
Clinical and public health implications
CLRD should not be viewed only as an accompanying diagnosis in older adults with lung cancer. Pulmonary impairment can influence candidacy for surgery, radiation planning, systemic treatment tolerance, symptom burden, and end-of-life care3. Comorbidity profiles are associated with treatment selection and survival in lung cancer3. The growing mortality share therefore supports care models that integrate respiratory assessment, smoking cessation, pulmonary optimization, and oncology rather than addressing these conditions in parallel.
Low-dose computed tomography reduces lung cancer mortality in high-risk populations16. The present data cannot measure screening eligibility, uptake, or follow-up, but the persistent rural and regional burden suggests that equitable access remains important. Screening alone is unlikely to eliminate this phenotype because many patients will already have clinically consequential respiratory disease2,3. Linked studies could evaluate whether spirometry, emphysema burden, oxygen dependence, rehabilitation, and treatment modification contribute to the slower population decline.
Strengths and limitations
This study used national mortality data through 2024, a specific directional case definition, a broad CLRD code set, subgroup-specific joinpoint modeling, and an internal overall lung cancer denominator. Quantifying annual and cumulative contribution adds information that is not conveyed by AAMR alone and makes the slower subgroup improvement clinically interpretable.
Several limitations remain. Death certificates are subject to misclassification, underreporting, and temporal or geographical variation in contributing-cause documentation17,18. The presence of a J40-J47 code does not establish current symptoms, physiologic severity, or a direct contribution to the terminal event. The operational J40-J47 definition also does not encompass all chronic pulmonary conditions, including interstitial lung diseases, and the CLRD category combines conditions with different pathophysiology and prognosis. The available aggregate data do not support reliable subtype-specific analysis.
The study lacked information on smoking status and intensity, environmental or occupational exposures, cancer histology and stage, pulmonary function, treatment, frailty, socioeconomic conditions, healthcare access, and goals of care. No multivariable regression or adjustment for potential confounders was performed; therefore, subgroup differences are unadjusted descriptive patterns and should not be interpreted as independent associations. Race and ethnicity may be misclassified, especially for American Indian or Alaska Native decedents. Area of residence analyses ended in 2020. The comparator included the primary phenotype, and no formal test established divergence between the two trend series. Finally, serial cross-sectional mortality data cannot establish incidence, survival after diagnosis, temporality, or causality.
CONCLUSIONS
Among US adults aged ≥65 years, the age-adjusted rate of lung cancer mortality with co-reported CLRD declined from 1999 through 2024, but annual deaths and the proportion of all lung cancer deaths increased. Progress was slower among females, adults aged ≥85 years, non-Hispanic American Indian or Alaska Native adults, residents of the Midwest and South, and non-metropolitan populations. The findings describe a growing documented respiratory component within fatal lung cancer and support linked clinical studies that may help clarify the contributions of pulmonary disease severity, smoking history, stage, treatment, and access to care to this mortality phenotype.