Dear Editor,
The severe form of Coronavirus Disease 2019 (COVID-19) is a systemic disease associated with high mortality rate1,2. Elderly, mainly men with comorbidities, are at increased risk of death. Νevertheless, younger individuals, without underlying diseases, may also develop lethal complications (myocarditis, disseminated intravascular coagulopathy, neurological complications etc.)3,4.
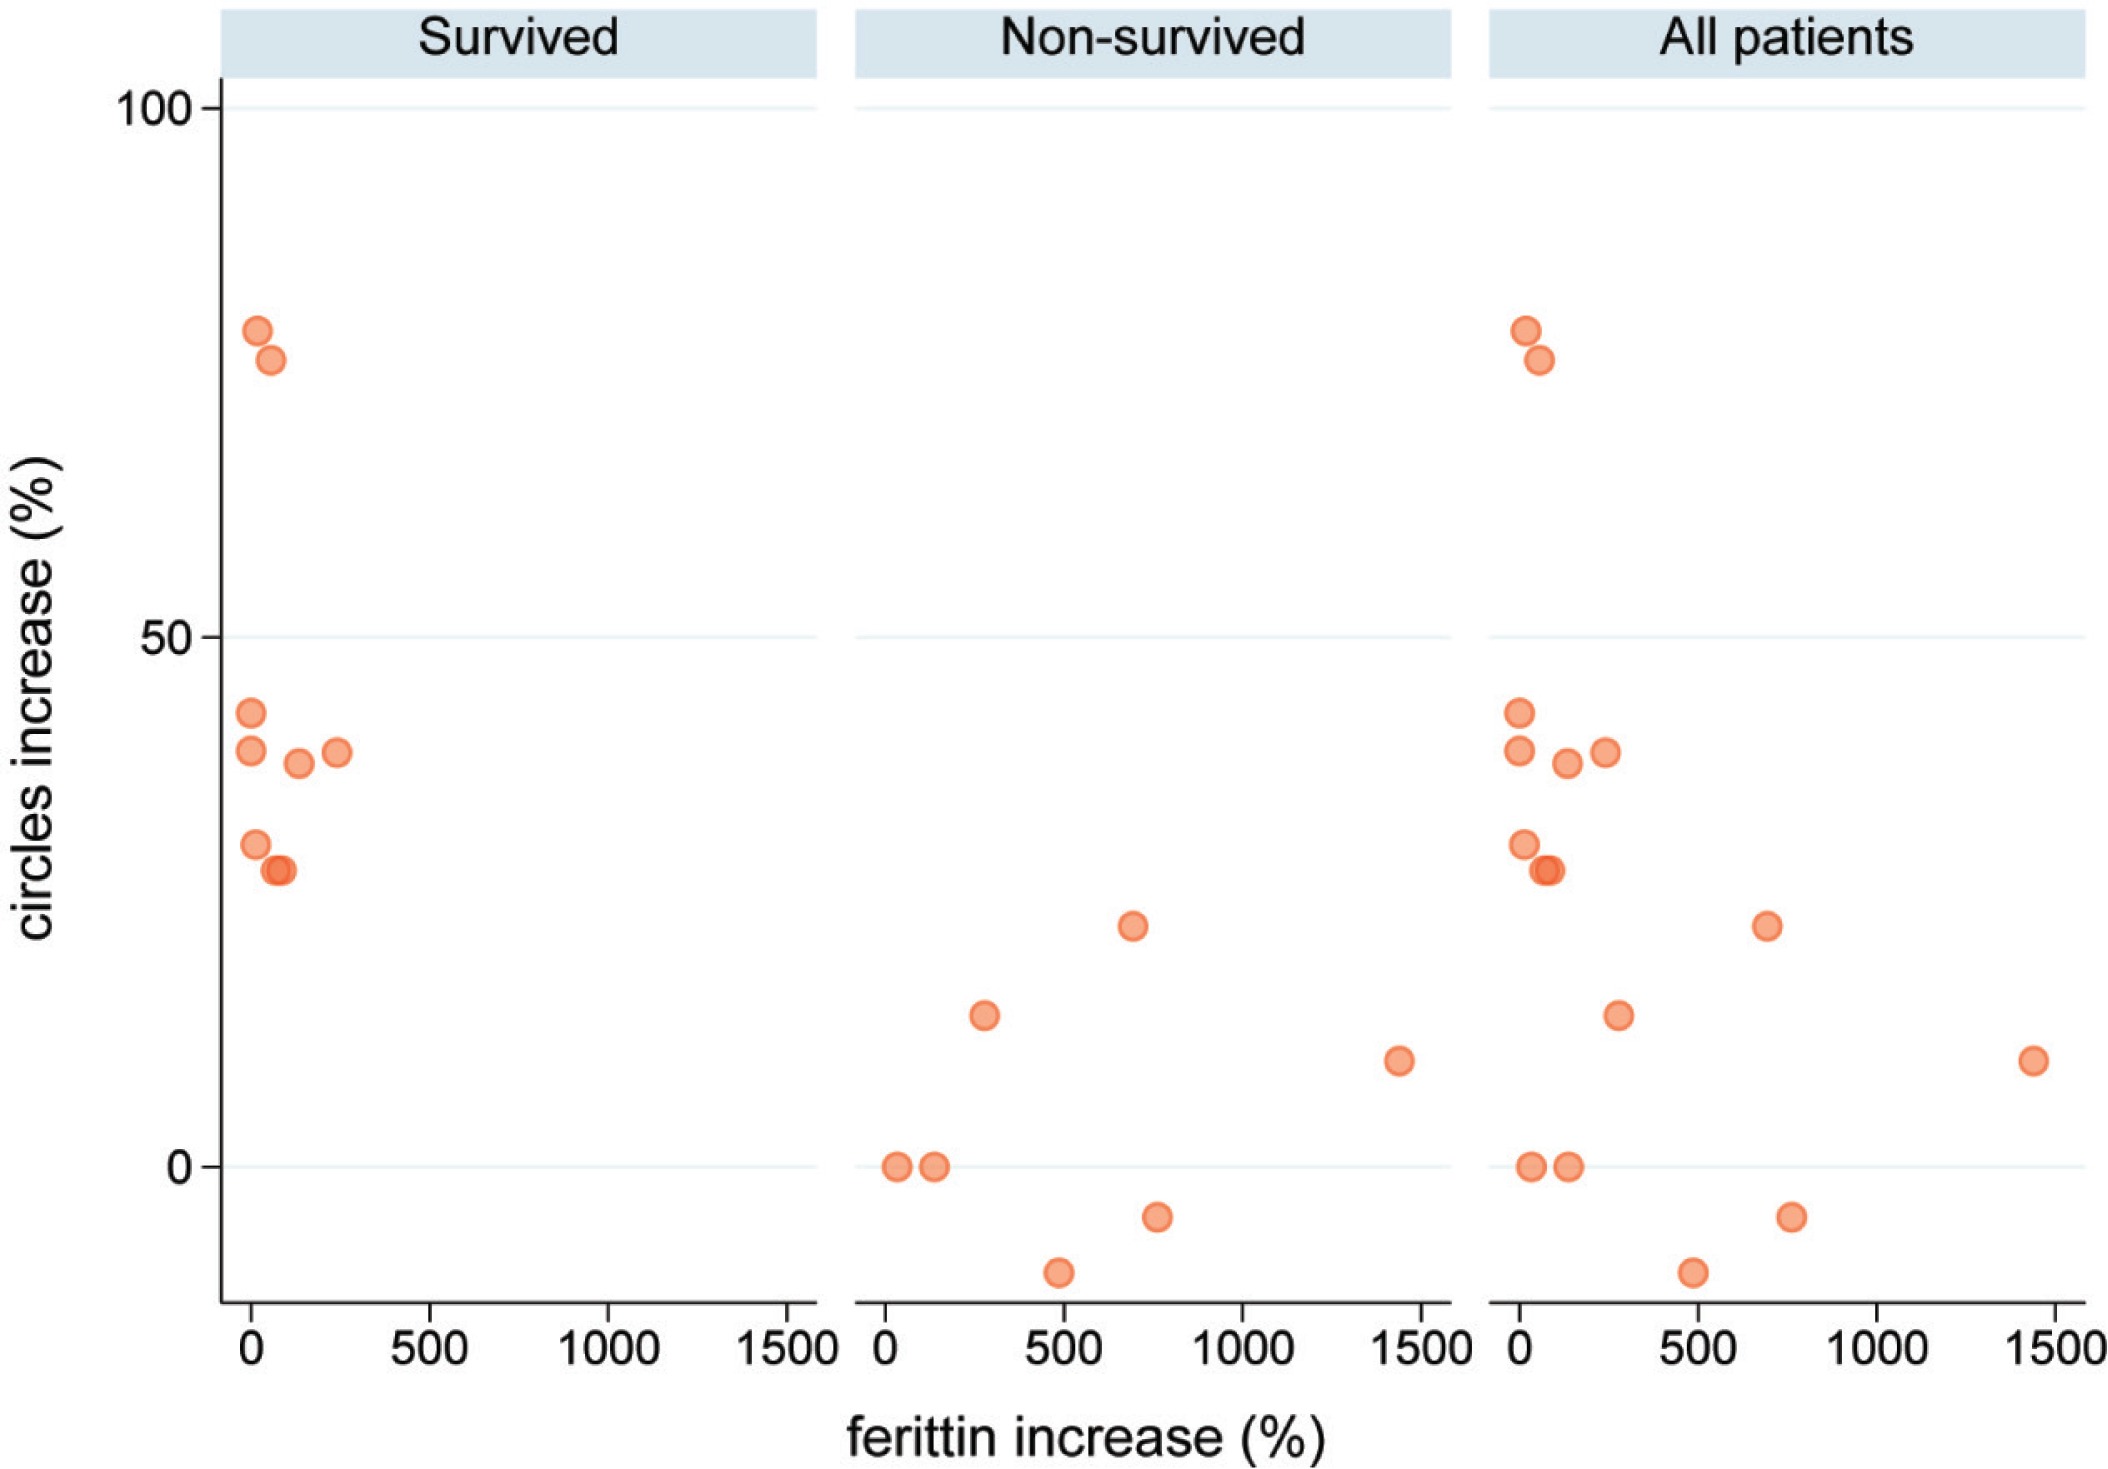
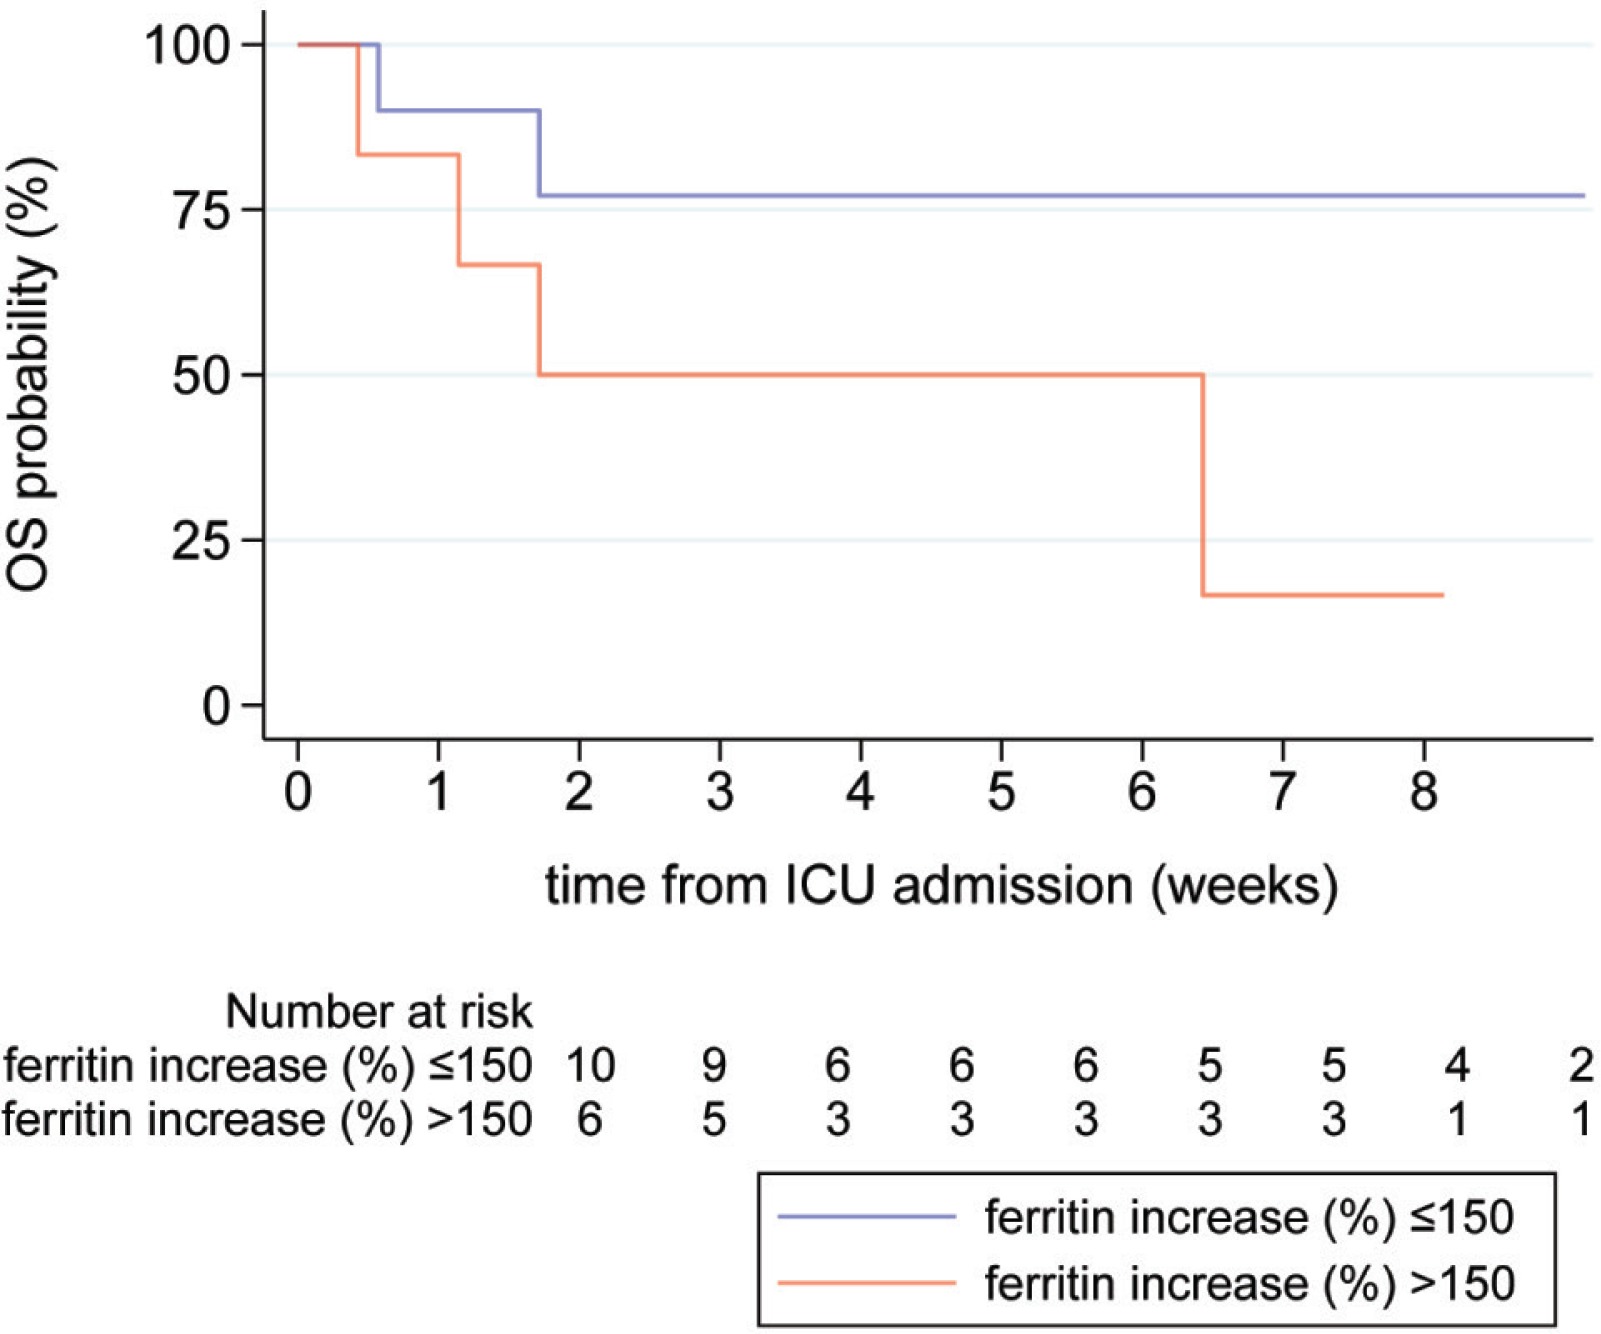
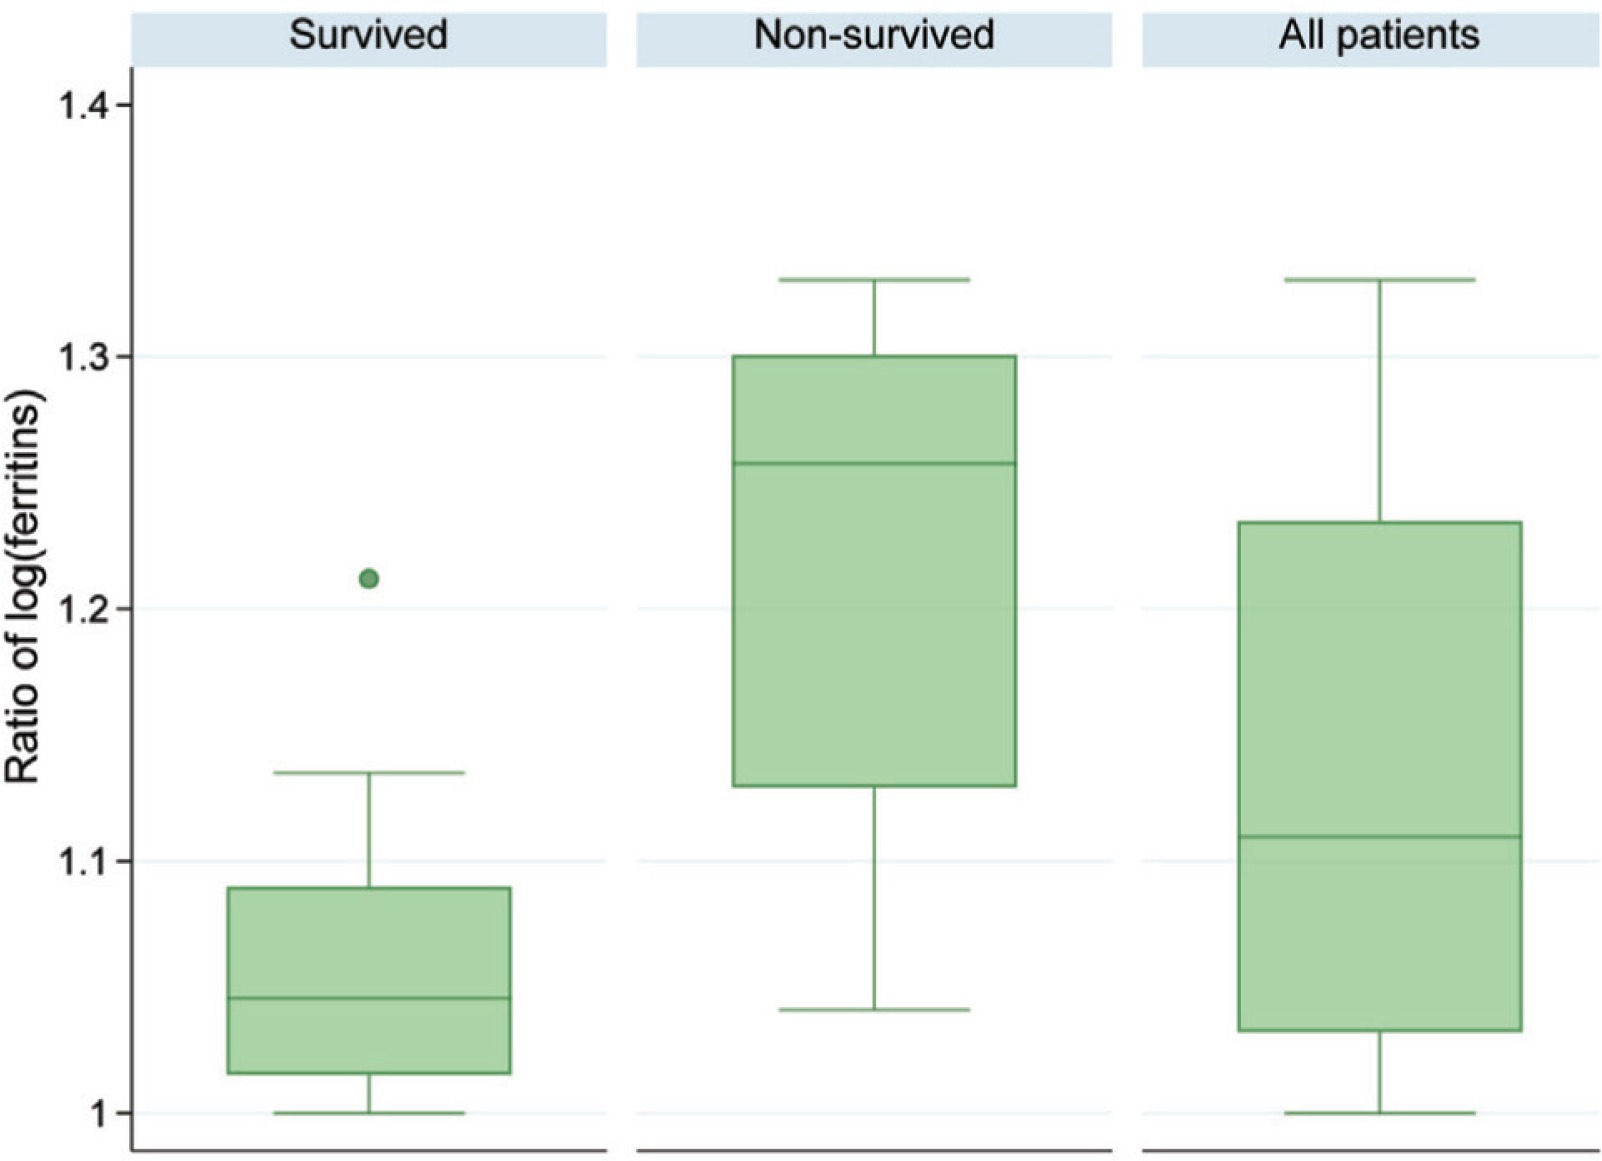
In the ICU of ATTIKON University Hospital (one of the 5 Reference Hospitals for COVID-19 in Athens, Greece), from 5 August to 30 September 2020, 16 (100%) critically ill patients with COVID-19 were admitted (median age 70.5 years, IQR 58–79). The patients were divided into survivors [Group A: 9 (56.3%)] and non-survivors [Group B: 7 (43.7%)](Table1). At the time of ICU admission, the viral load of coronavirus (expressed in Circles trough: Ct) was significantly higher in non-survivors [Group A: 23 (IQR 21–25) vs Group B: 21 (IQR 20–22), p=0.042], while ferritin levels were similar in both groups [Group A: 1290 ng/mL (IQR 550–3572) vs Group B: 980 (IQR 543–3915), p=0.71]. During ICU stay, the viral load remained permanently high in non-survivors [Group A: 32 (IQR 32–37) vs Group B: 22 (IQR 19–24), p=0.001], but it was gradually diminished among survivors [Group A: 39.1% (IQR 30.4–42.9) vs Group B: 0 (IQR -4.8–14.30), p=0.001]. In parallel, ferritin levels were increased by 109.7% (IQR 25.7–382), whatever was higher in non-survivors [Group A: 55.7% (IQR 13.3–85) vs Group B: 486.1% (IQR 137.2–761.9), p=0.007] (Table 1). The HScore, which is an indicator of macrophage activation, was higher in non-survivors [Group A: 54 (IQR 19–70) vs Group B: 87 (IQR 68–99), p=0.048)]. Finally, in this cohort, 9 (56.3%) patients survived and 7 (43.7%) died because of ARDS/Multiple Organ Failure (MOF) (one of the patients developed myocarditis).
Table 1
Demographics, clinical and laboratory data of all patients, survivors and non-survivors (N=16)
| Parameters | All patients | Survivors N=9 (56.3%) | Non-survivors N=7 (43.7%) | p |
|---|---|---|---|---|
| Age (years) | 70.5 (58–79) | 75 (54–79) | 67 (62–79) | 0.92 |
| Gender | 0.55 | |||
| Male | 13 (81.3) | 8 (88.9) | 5 (71.4) | |
| Female | 3 (18.7) | 1 (11.1) | 2 (28.6) | |
| Comorbidities | ||||
| Hypertension | 12 (8) | 6 (66.7) | 6 (85.7) | 0.59 |
| Cardiovascular disorders | 7 (43.8) | 6 (66.7) | 1 (14.3) | 0.06 |
| Diabetes II | 4 (3) | 1 (11.1) | 3 (42.9) | 0.26 |
| COPD | 4 (25) | 2 (22.2) | 2 (28.6) | >0.99 |
| Malignancy | 3 (18.8) | 1 (11.1) | 2 (28.6) | 0.55 |
| Epilepsy | 2 (12.5) | 2 (22.2) | 0 (0) | 0.48 |
| Obesity | 1 (6.3) | 1 (11.1) | 0 (0) | >0.99 |
| Renal failure | 1 (6.3) | 0 (0) | 1 (14.3) | 0.44 |
| Thrombophilia | 1 (6.3) | 1 (11.1) | 0 (0) | >0.99 |
| Admission | 0.63 | |||
| Directly from ER | 6 (37.5) | 4 (44.4) | 2 (28.6) | |
| From clinical floor | 10 (62.5) | 5 (55.6) | 5 (71.4) | |
| Time to ICU admission (days) | 3.5 (0–7) | 1 (0–7) | 4 (0–5) | 0.87 |
| APACHE II admission | 20 (18.5–21.5) | 20 (18–21) | 21 (19–24) | 0.33 |
| SOFA score | 13.5 (11.5–15) | 13 (12–14) | 15 (11–15) | 0.23 |
| Ferritin (admission), ng/mL | 1046.5 (546.5–3748.5) | 1290 (550–3572) | 980 (543–3915) | 0.71 |
| Ferritin (ICU stay), ng/mL | 2295 (1503.5–6366.5) | 1735 (1289–4058) | 2538 (1895–36940) | 0.19 |
| Ferritin levels increase | 109.7 (25.7–382) | 55.7 (13.3–85) | 486.1 (137.2–761.9) | 0.007* |
| Time of highest ferritin levels (day since admission) | 12.5 (5.5–23.5) | 10 (5–23) | 16 (6–24) | 0.75 |
| Viral load (Ct) admission | 21.5 (20.5–24) | 23 (21–25) | 21 (20–22) | 0.042* |
| Viral load (Ct)a | 29.5 (22–33) | 32 (32–37) | 22 (19–24) | 0.001* |
| Viral load reduction (Ct) (%) | 28 (5–39.2) | 39.1 (30.4–42.9) | 0 (-4.8–14.3) | 0.001* |
| Temperature (℃)a | 38.1 (37.3–38.9) | 38 (37.7–38.5) | 38.4 (36–40.5) | 0.71 |
| PaO2/FiO2a | 123.5 (114–159) | 125 (115–195) | 122 (53–156) | 0.56 |
| WBC (x109/L)a | 14600 (10200–17900) | 13200 (9300–15900) | 16900 (11980–27580) | 0.19 |
| Neutrophils (%) | 81 (77.5–88) | 81 (80–83) | 87 (61–89) | 0.67 |
| Neutrophils absolute number | 10380 (7530–14450) | 10000 (7460–13200) | 13600 (7600–15100) | 0.32 |
| Lymphocytes (%) | 7 (5–12) | 10 (6–11) | 6 (5–26) | 0.75 |
| Lymphocytes absolute number | 780 (695–1262) | 770 (640–920) | 790 (750–1290) | 0.47 |
| Hba | 11.3 (9.3–13) | 11.5 (11–13) | 11 (8.5–13) | 0.63 |
| Platelets (x109/L)a | 258 (224–317) | 252 (208–318) | 258 (249–289) | 0.96 |
| Cytopeniaa | 5 (31.3) | 2 (22.2) | 3 (42.9) | 0.60 |
| Fibrinogena | 502.5 (426–775.5) | 484 (456–782) | 626 (396–769) | 0.87 |
| AST (μKat/L)a | 87 (39.5–244.5) | 115 (33–168) | 59 (41–548) | 0.71 |
| LDHa | 449.5 (365–627) | 399 (330–521) | 596 (378–628) | 0.19 |
| HS scorea | 69.5 (50.5–87) | 54 (19–70) | 87 (68–99) | 0.048* |
| Inotropic agents | 13 (81.3) | 6 (66.7) | 7 (100) | 0.21 |
| CRRT | 2 (14.3) | 1 (11.1) | 1 (20) | >0.99 |
| Length of ICU stay (days) | 37 (8.5–52.5) | 52 (29–57) | 12 (4–45) | 0.033* |
Values are expressed as number (%) or median (IQR). IQR: interquartile range. Patients presented more than one comorbidity. AST: Aspartate Aminotransferase. APACHE II: Acute Physiology And Chronic Health Evaluation II. COPD: Chronic Obstructive Pulmonary Disease. CRRT: Continuous Renal Replacement Treatment. HS score: hemophagocytic syndrome. LDH: Lactate Dehydrogenase. SOFA: Sequential Organ Failure Assessment. WBC: White Blood Cells count.
A consistent proportion of COVID-19 patients will develop acute respiratory distress syndrome (ARDS) related to increased production of cytokines (the so-called cytokine storm) and a small subset secondary haemophagocytic lymphohistiocytosis (sHLH), a T-cell driven hyperinflammatory, ‘hyperferritinemic syndrome’5. These are the two main causes of mortality in the severe form of COVID-19. The sHLH development reflects the ability of coronavirus to bind TLRs and to activate inflammasome through IL-1β release, but the relationship is not clear since many COVID-19 patients, even with bad prognosis, do not meet the classification criteria of HScore (Table 2)6,7. In light of the absence of highly increased HScore, ferritin remains high and reveals constant macrophage activation albeit not to such an extent as to be the full-blown sHLH8-10. In our cohort, high viral load and ferritin levels have been observed in non-survivors indicating a relation between the activity of the disease and the outcome of the patients. A future research perspective could be focused on the following three questions: a) ‘Is COVID-19 a hyperferritinemic syndrome without being full-blown sHLH?’; b) ‘Is there a need to revalidate sHLH and HScore cut-off limits in these patients?’; and c) ‘When in the course of the COVID-19 infection may the clinicians consider starting immunomodulatory treatment?’.