
INTRODUCTION
Seasonal influenza is an acute respiratory infection caused by influenza viruses1. It is considered one of the major global infectious disease challenges and is associated with high morbidity and mortality in the elderly, often resulting in months of hospitalization2,3. The World Health Organization (WHO) estimates that 0.29 million to 0.65 million people annually die due to flu-related causes worldwide4 and it has been identified as the disease with the highest burden, with 81.8 DALYs per 100000 population5.
Vaccination against the flu is the best tool for prevention against seasonal infection but remains inadequate6,7. In Europe, the last available data regarding vaccination coverage refers to the 2015–2016, 2016–2017 and 2017–2018 influenza seasons, and on average is 47.1% (range: 2.0–72.8) in the elderly, 30.2% (range: 15.6–63.2) in healthcare workers (HCWs), 44.9% (range: 15.7–57.1) in patients with chronic medical conditions, and 25% (range: 0.5–58.6) in pregnant women8. In general, a vaccine effectiveness of about 30–60% has been estimated for the three different influenza A (H1N1, H3N2) and B strains (Victoria or Yamagata lineages)9. However, the elderly may be insufficiently protected by vaccination due to the immunosenescence which accompanies aging10. The seasonal flu vaccine is changed every year to keep up with the three strains of the virus that research suggests will be most common in the upcoming flu season9. For this reason, it is necessary to get a new vaccine every year to stay safe.
Influenza vaccination coverage in the Greek population was 32.5% in 2013–201411, and 56.6% among the elderly in 201812. Even among HCWs, vaccination uptake is low. Only 18% of HCWs in acute care hospitals and 34.6% in primary healthcare centers vaccinated for seasonal influenza in 2016–201713. The national influenza vaccination program that is implemented in Greece is presented in Supplementary file A.
The recent COVID-19 pandemic has already affected the lives of millions of people worldwide. More than 76 million people have been diagnosed with COVID-19 worldwide with over 1.6 million related deaths since December 202014-16. SARS-CoV-2 spreads easily, and the majority of the world population remains vulnerable due to the unavailability of vaccination and possible effective treatment17-19. Influenza vaccination could be an effective strategy to reduce the severity of the COVID-19 disease in the general population, but data is limited20. The aim of our study was to assess the impact of the SARS-CoV-2 pandemic on the seasonal influenza vaccination attitudes in Greece and to identify factors associated with a positive change in participants’ choice to vaccinate against the flu.
METHODS
Study design and study participants
This is a sub-analysis of a cross-sectional survey that was conducted across Greece, between 28 April and 3 May 2020 (last week of lockdown) to assess the knowledge, attitudes and practices (KAP) of the Greek general adult population against COVID-19. In order to select a representative sample of the urban/rural population, a proportionate stratified by region systematic sampling procedure was used based on the distribution of the population according to the census of 2011 (www.statistics.gr). To ensure the external validity and the greater generalizability of the study, survey weights were used to adjust for differences in age and gender distribution between survey sample and country population as obtained from the census 2011 (www.statistics.gr). The survey weights were calculated with the rake method (also known as ‘rim’).
Data collection included both computer assisted telephone interviewing (CATI) and computer assisted web interviewing (CAWI). Participants reached 1004 adults (50% through CATI and 50% through CAWI). Respondents’ consent was taken before the interview and participants were assured of confidentiality and anonymity. It was not deemed necessary to submit the study for an ethics approval as per Greek legislation (Association of Opinion Polls and Survey Organizations - www.sedea.gr).
Data collection
A structured questionnaire was developed consisting of four parts: 1) demographics (participants’ sociodemographic information); 2) knowledge about COVID-19; 3) attitudes toward COVID-19; and 4) practices to control COVID-19 and vaccination against the flu. Completion time was approximately 9–12 minutes. Three independent reviewers pre-validated the questionnaire, and 6 individuals were used to pre-test the study (responses were not included in the analyzed data).
Knowledge about COVID-19 was assessed by 23 questions. Assigning 1 point to each correct answer led to a total knowledge score ranging from 0 to 23. The answers considered correct are presented in Supplementary file B. A higher score indicated better knowledge. Cronbach’s alpha coefficient was used to assess the internal consistency of the questions used in the total score and it was found to be 0.580, indicating ‘poor’ internal reliability. Participants’ source of information about COVID-19 was also stated.
Attitudes towards COVID-19 were measured through 8 questions and practices relevant to COVID-19 control were measured through 7 questions. Among the practices assessed was whether participants had received a flu vaccine the previous season (2019–2020) and their intention to vaccinate against the flu the next season (2020–2021) with responses options: ‘yes’, ‘no’ and ‘don't know’.
Statistical analysis
Participant responses are presented with absolute and relative frequencies (%) as well as graphically with bar charts, whereas knowledge score is presented with median and interquartile range (IQR). The chi-squared test of independence was used to identify possible factors (demographics, knowledge, attitudes and practices against COVID-19) associated with participants’ intention to get vaccinated against the flu next season, even though they had not vaccinated during the previous season.
Multiple logistic regression was performed to estimate the impact of those factors on the probability of the same group of participants’ getting vaccinated against the flu. Results are presented with odds ratios (ORs) and 95% confidence intervals (CIs). The level of statistical significance was set to 5%. Analysis was conducted with SPSS statistical package v.25.
RESULTS
Characteristics of participants
In total, 1004 adults responded to the survey with mean age 41.7 years (SD: 17.7). Sociodemographic characteristics of the sample are presented in Supplementary file C. Indicatively, 51.0% were female, 59.8% had college or above education level, 63.8% were married or cohabiting, 31.6% had children, and 52.0% reported that they worked before COVID-19 measures were taken. Almost half of respondents reported that they belong to a vulnerable group or they were living with someone belonging to a vulnerable group. Of the participants, 4.1% (41) were healthcare professionals (9 doctors, 10 nurses, and 20 other healthcare professionals).
Participants’ flu vaccination during the 2019–2020 season and intention to vaccinate in the upcoming season
Study participants stated that during the 2019–2020 flu season, 32.6% had received a flu vaccine (n=327) vs 66.3% that did not (n=665). However, the intention to get a flu vaccine the upcoming flu season (2020–2021) was higher at 45.3% (n=455), and the intention not to get vaccinated was lower at 40.6% (n=407).
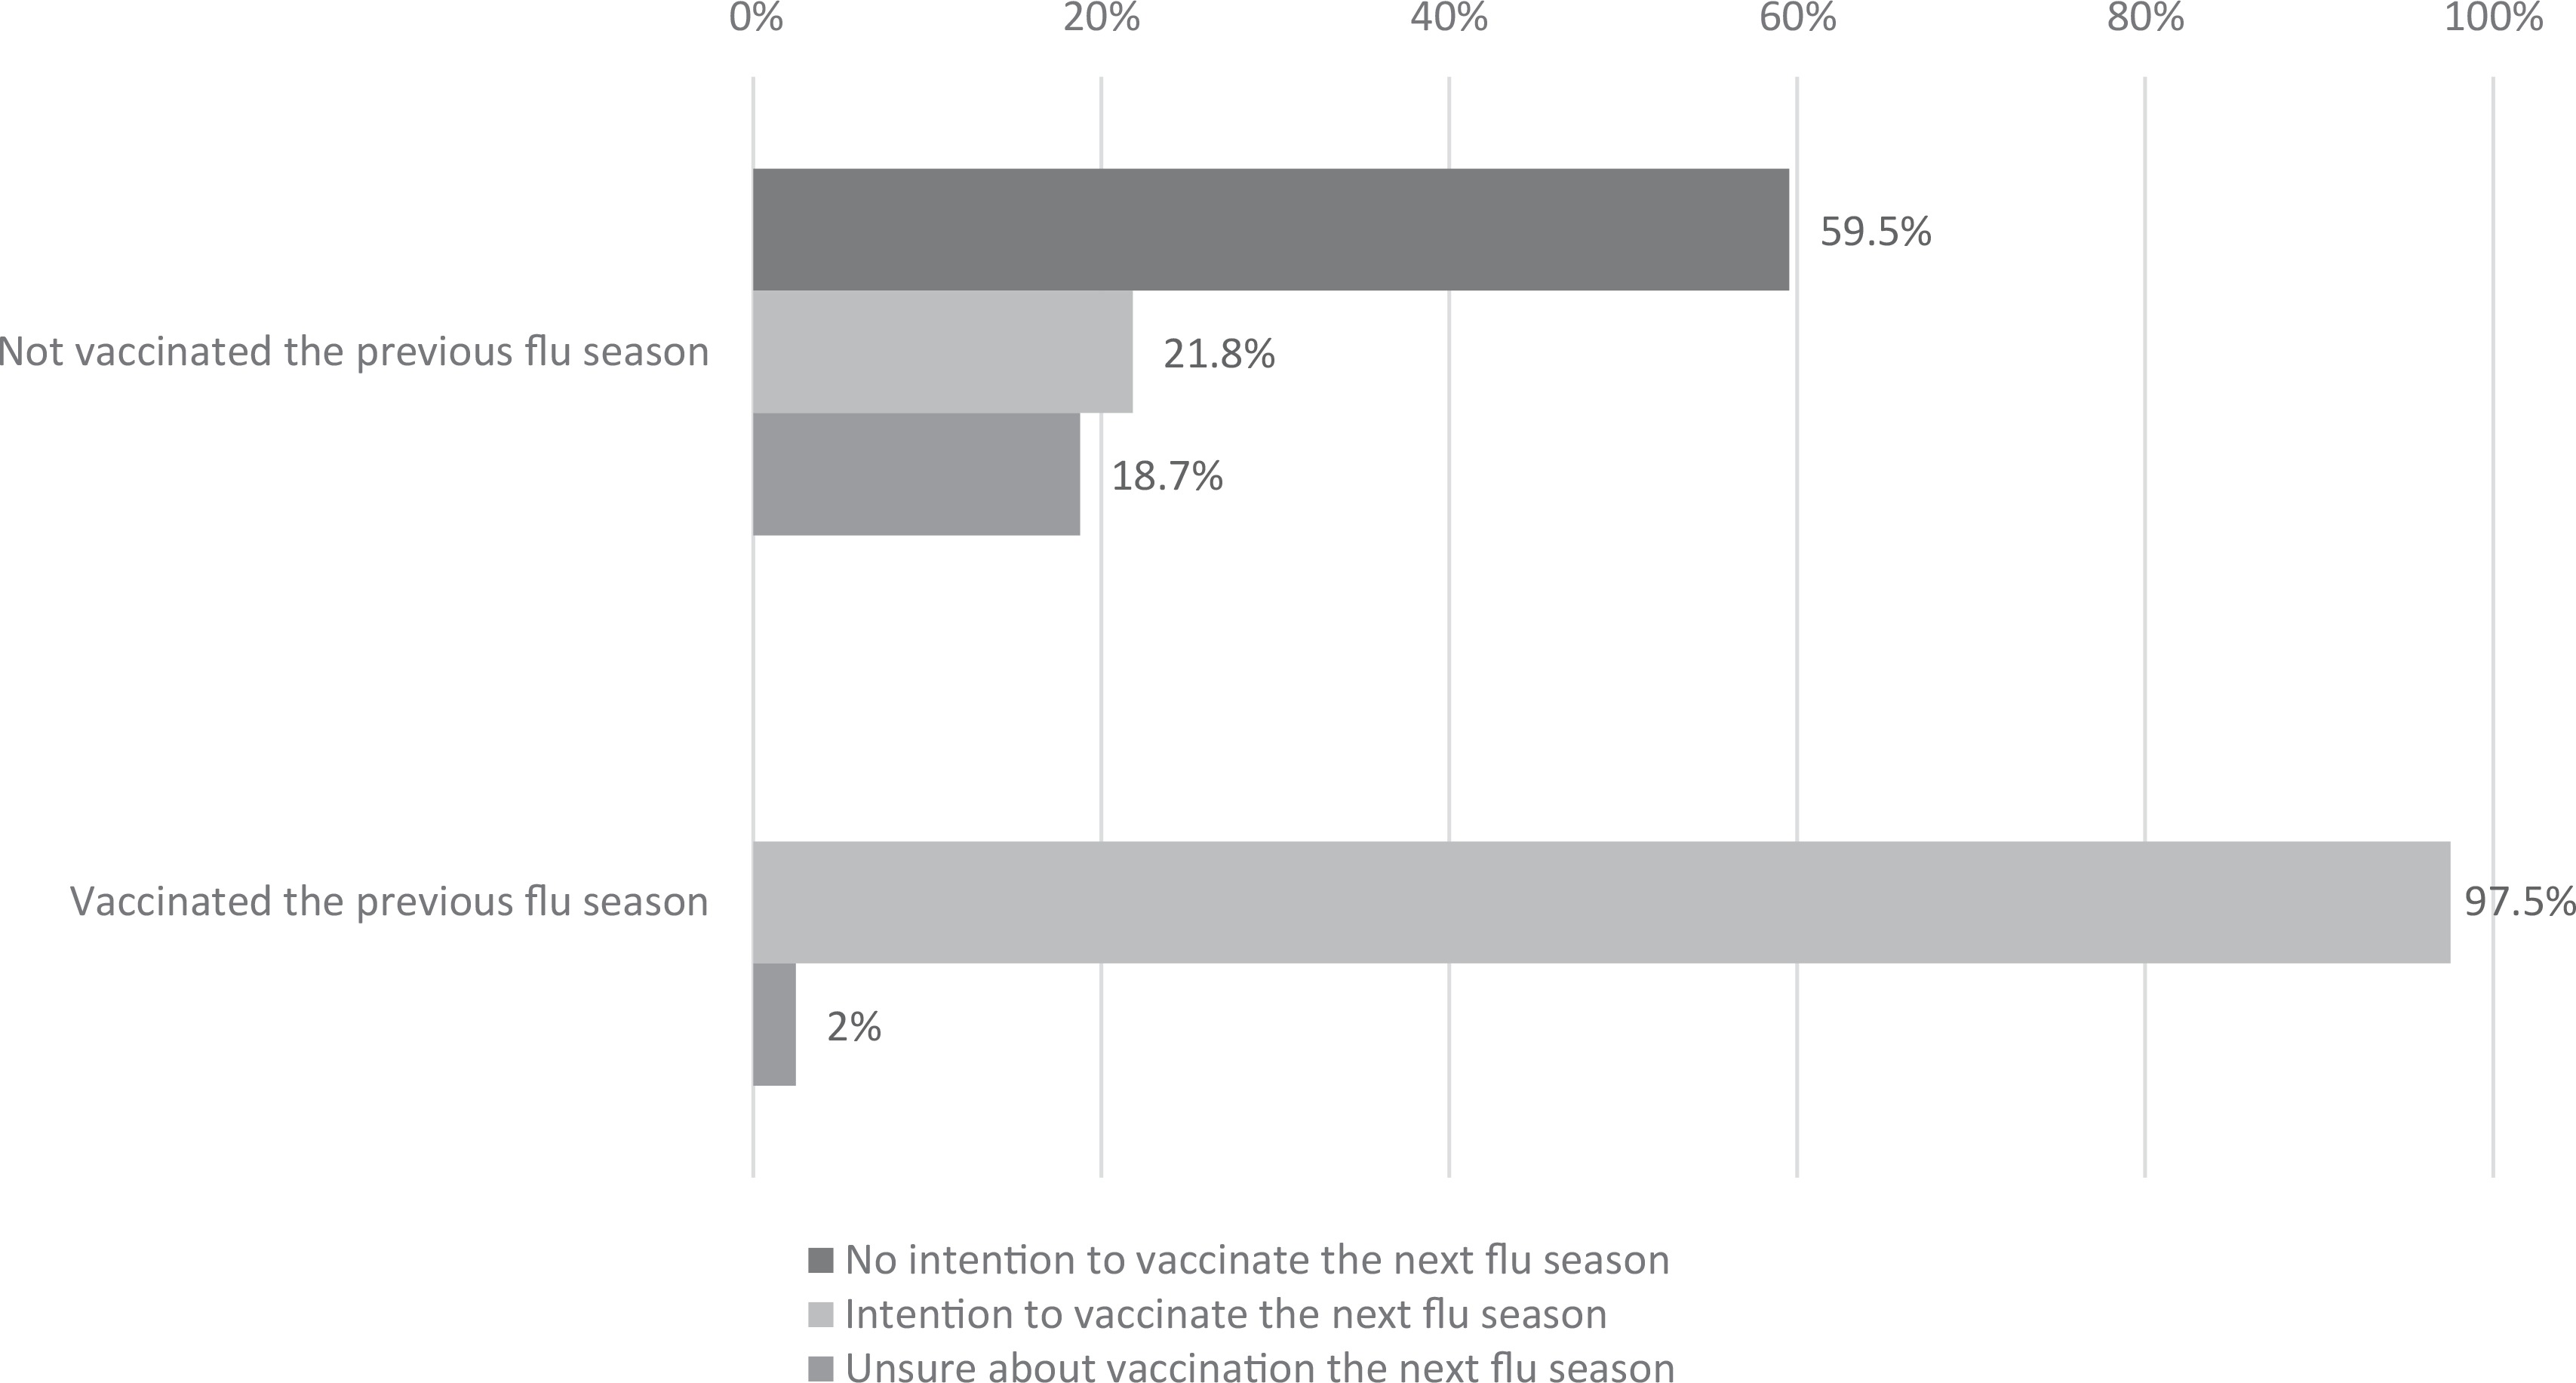
Figure 1 presents the distribution of participants’ decision on vaccination against the flu for the next season stratified by vaccination status of the previous season. Almost all (97.6%) previously vaccinated respondents were consistent in again being vaccinated against the flu and only 2.4% expressed uncertainty about what they would do next. In contrast, previously unvaccinated respondents seemed less adamant about not vaccinating again. Only 59.5% stated that they do not intend to vaccinate next season (n=396), while 21.8% expressed that they would be willing to vaccinate the next season after all (n=145). The remaining 18.8% (n=125) were ‘unsure’ about their decision to get vaccinated in the next season, at the time of the survey.
Factors associated with change in participants’ intention to vaccinate against the flu
We examined the group of participants that intended to vaccinate the following season, despite not having been vaccinated during the previous season, in greater detail (Ν=665). Their sociodemographic characteristics are presented in Table 1. Elderly participants (aged ≥65 years) (OR=1.90; 95% CI: 1.12–3.22, p=0.017), those who were married/cohabiting (OR=1.64; 95% CI: 1.06–2.53, p=0.025) and divorced/widowed (OR=2.71; 95% CI: 1.38–5.33, p=0.004), were significantly more likely to have a positive change in their decision to vaccinate against the flu over their counterparts.
Table 1
Associations between demographic characteristics and flu vaccination for next season, for those who were not vaccinated during the 2019–2020 season (N=665)
| Characteristics | Intension to vaccinate against the flu next season | ||||
|---|---|---|---|---|---|
| Total n (%) | No/don’t know (N=520) n (%) | Yes (N=145) n (%) | p | OR (95% CI)§ | |
| Gender | 0.479 | ||||
| Male | 332 (49.8) | 263 (79.3) | 69 (20.7) | 1.00 | |
| Female | 334 (50.2) | 257 (77.1) | 77 (22.9) | 1.14 (0.79–1.65) | |
| Age (years) | 0.035 | ||||
| 18–24 | 77 (11.5) | 67 (87.3) | 10 (12.7) | 1.00 | |
| 25–34 | 140 (21.0) | 114 (81.4) | 26 (18.6) | 1.57 (0.71–3.49) | |
| 35–44 | 151 (22.7) | 119 (78.7) | 32 (21.3) | 1.87 (0.86–4.05) | |
| 45–54 | 136 (20.4) | 108 (79.4) | 28 (20.6) | 1.78 (0.81–3.93) | |
| 55–64 | 89 (13.3) | 63 (71.7) | 25 (28.3) | 2.71 (1.20–6.14)* | |
| ≥65 | 73 (11.0) | 49 (67.2) | 24 (32.8) | 3.36 (1.46–7.71)* | |
| Age (years) | 0.015 | ||||
| <65 | 592 (89.0) | 471 (79.5) | 121 (20.5) | 1.00 | |
| ≥65 | 73 (11.0) | 49 (67.2) | 24 (32.8) | 1.90 (1.12–3.22)* | |
| Residence | 0.370 | ||||
| Athens | 224 (33.7) | 170 (75.9) | 54 (24.1) | 1.00 | |
| Thessaloniki | 92 (13.9) | 75 (81.6) | 17 (18.4) | 0.71 (0.39–1.30) | |
| Urban area (>10000 inhabitants) | 218 (32.7) | 166 (76.5) | 51 (23.5) | 0.97 (0.62–1.50) | |
| Semi-urban or agricultural area | 131 (19.7) | 109 (82.6) | 23 (17.4) | 0.66 (0.39–1.15) | |
| Education level | 0.370 | ||||
| Primary school | 28 (4.2) | 20 (72.1) | 8 (27.9) | 1.00 | |
| Middle school | 211 (31.7) | 171 (80.9) | 40 (19.1) | 0.61 (0.25–1.49) | |
| College and above | 426 (64.0) | 329 (77.3) | 97 (22.7) | 0.76 (0.32–1.78) | |
| Marital status | 0.007 | ||||
| Single | 215 (32.7) | 181 (84.2) | 34 (15.8) | 1.00 | |
| Married/cohabiting | 392 (59.3) | 299 (76.4) | 92 (23.6) | 1.64 (1.06–2.53)* | |
| Divorced/widowed | 53 (8.0) | 35 (66.2) | 18 (33.8) | 2.71 (1.38–5.33)* | |
| Children | 0.514 | ||||
| No | 429 (65.3) | 333 (77.6) | 96 (22.4) | 1.00 | |
| Yes | 229 (34.7) | 182 (79.8) | 46 (20.2) | 0.88 (0.59–1.30) | |
| Do you personally belong to a vulnerable group? | 0.112 | ||||
| No | 517 (78.5) | 410 (79.3) | 107 (20.7) | 1.00 | |
| Yes | 141 (21.5) | 103 (72.9) | 38 (27.1) | 1.42 (0.93–2.18) | |
| Living with someone belonging to a vulnerable group? | 0.528 | ||||
| No | 425 (64.6) | 328 (77.2) | 97 (22.8) | 1.00 | |
| Yes | 233 (35.4) | 184 (79.2) | 48 (20.8) | 0.89 (0.60–1.32) | |
| Belonging or living with someone belonging to a vulnerable group? | 0.390 | ||||
| No | 361 (54.9) | 286 (79.2) | 75 (20.8) | 1.00 | |
| Yes | 297 (45.1) | 227 (76.4) | 70 (23.6) | 1.17 (0.81–1.70) | |
| Worked before coronavirus outbreak | 0.278 | ||||
| No | 257 (38.9) | 195 (75.8) | 62 (24.2) | 1.00 | |
| Yes | 404 (61.1) | 321 (79.5) | 83 (20.5) | 0.81 (0.55–1.17) | |
We also looked at this group’s knowledge on symptoms, transmission routes and prevention /control measures against COVID-19 (Table 2). Participants who knew the symptoms of COVID-19 (OR=1.71; 95% CI: 1.17–2.50, p=0.005), those who think that vaccination against the flu is considered a preventative measure against the spread of the coronavirus (OR=2.84; 95% CI: 1.74–4.64, p=0.001) and those who knew the appropriate way of handwashing with soap and water (OR=1.46; 95% CI: 1.01–2.12, p=0.043) were also significantly more likely to upwardly change their intent to vaccinate against the flu.
Table 2
Associations between knowledge and attitudes against corona virus and flu vaccination for next season, for those who were not vaccinated during the 2019–2020 season (N=665)
| Intension to vaccinate against the flu next season | |||||
|---|---|---|---|---|---|
| Total n (%) | No/don’t know (N=520) n (%) | Yes (N=145) n (%) | p | OR (95% CI)§ | |
| Knowledge of symptomsa | 0.004 | ||||
| No | 447 (67.1) | 363 (81.3) | 83 (18.7) | 1.00 | |
| Yes | 219 (32.9) | 157 (71.8) | 62 (28.2) | 1.71 (1.17–2.50)* | |
| Knowledge of transmission routesa | 0.332 | ||||
| No | 528 (79.4) | 418 (79.0) | 111 (21.0) | 1.00 | |
| Yes | 137 (20.6) | 103 (74.8) | 34 (25.2) | 1.27 (0.82–1.97) | |
| Knowledge of prevention measuresa | 0.769 | ||||
| No | 552 (82.9) | 433 (78.4) | 119 (21.6) | 1.00 | |
| Yes | 114 (17.1) | 88 (77.1) | 26 (22.9) | 1.08 (0.66–1.74) | |
| Vaccination against flu is considered a measure to prevent the spread of coronavirus | 0.001 | ||||
| No | 479 (72.0) | 384 (80.1) | 96 (19.9) | 1.00 | |
| Yes | 83 (12.4) | 48 (58.6) | 34 (41.4) | 2.84 (1.74–4.64)* | |
| Don’t know | 103 (15.5) | 88 (85.2) | 15 (14.8) | 0.25 (0.12–0.49)* | |
| Knowledge of correct first action in case of COVID-19 related symptomsa | 0.388 | ||||
| No | 140 (21.3) | 113 (80.5) | 27 (19.5) | 1.00 | |
| Yes | 519 (78.7) | 402 (77.3) | 118 (22.7) | 1.21 (0.76–1.92) | |
| Knowledge of the appropriate way of hand washing with soap and watera | 0.037 | ||||
| No | 394 (59.2) | 319 (80.9) | 75 (19.1) | 1.00 | |
| Yes | 271 (40.8) | 201 (74.3) | 70 (25.7) | 1.46 (1.01–2.12)* | |
| Is handwashing with antiseptic/alcoholic solution better than soap and water? | 0.379 | ||||
| No | 534 (80.2) | 414 (77.5) | 120 (22.5) | 1.00 | |
| Yes | 132 (19.8) | 107 (80.8) | 25 (19.2) | 0.82 (0.51–1.33) | |
| Median (IQR) | Median (IQR) | Median (IQR) | |||
| Total knowledge scorea | 18 (16–19) | 18 (16–19) | 18 (16–19) | 0.103 | 1.07 (0.99–1.15) |
Associations between the participants’ attitudes and practices towards COVID-19 and their intention to get vaccinated against the flu the following season (while they had not in the previous season) are presented in Table 3. Participants believing that the SARS-CoV-2 virus was developed in laboratories by humans (OR=0.56; 95% CI: 0.37–0.86, p=0.008) and those believing that the spread of COVID-19 will be eliminated when a large percentage of the population has become infected (OR=0.37; 95% CI: 0.22–0.65, p<0.001) were less likely to have a positive change in their decision to vaccinate against the flu the following season. On the other hand, those believing that coronavirus is far more contagious (OR=2.06; 95% CI: 1.23–3.45, p=0.006) and lethal compared to the H1N1 virus (OR=2.03; 95% CI: 1.31–3.15, p=0.005), those believing that there will be consecutive epidemic COVID-19 waves in the future (OR=1.77; 95% CI: 1.13–2.79, p=0.012) and those who applied social distancing before government measures (OR=1.62; 95% CI: 1.12–2.36, p=0.010) were significantly more likely to have a positive change in their decision to vaccinate against the flu next season compared to their counterparts.
Table 3
Associations between attitudes and practices against corona virus and flu vaccination for next season, for those who were not vaccinated during the 2019–2020 season (N=665)
| Intension to vaccinate against the flu next season | |||||
|---|---|---|---|---|---|
| Total n (%) | No/don’t know (N=520) n (%) | Yes (N=145) n (%) | p | OR (95% CI)§ | |
| Do you believe that the novel coronavirus was developed by humans in laboratories? | 0.026 | ||||
| No | 196 (29.5) | 141 (71.7) | 56 (28.3) | 1.00 | |
| Yes | 316 (47.5) | 258 (81.8) | 58 (18.2) | 0.56 (0.37–0.86)* | |
| Don’t know | 153 (23.0) | 121 (79.2) | 32 (20.8) | 0.67 (0.40–1.10) | |
| Coronavirus far more infectious compared to the flu virus H1N1 | 0.005 | ||||
| No | 145 (22.9) | 125 (86.2) | 20 (13.8) | 1.00 | |
| Yes | 485 (77.1) | 365 (75.2) | 121 (24.8) | 2.06 (1.23–3.45)* | |
| Coronavirus far more lethal compared to the flu virus H1N1 | 0.001 | ||||
| No | 211 (33.8) | 179 (85.0) | 32 (15.0) | 1.00 | |
| Yes | 412 (66.2) | 303 (73.6) | 109 (26.4) | 2.03 (1.31–3.15)* | |
| Do you think that the spread of the novel coronavirus will be mitigated when a large percentage of the population has become infected? | 0.001 | ||||
| No | 463 (76.1) | 342 (74.0) | 120 (26.0) | 1.00 | |
| Yes | 145 (23.9) | 128 (88.4) | 17 (11.6) | 0.37 (0.22–0.65)* | |
| Very likely to have other waves of coronavirus outbreaks in our country | 0.012 | ||||
| No | 180 (27.8) | 151 (84.3) | 28 (15.7) | 1.00 | |
| Yes | 467 (72.2) | 351 (75.2) | 116 (24.8) | 1.77 (1.13–2.79)* | |
| Where you in the process of social distancing before the government measures were applied? | 0.010 | ||||
| No | 384 (58.7) | 313 (81.6) | 71 (18.4) | 1.00 | |
| Yes | 271 (41.3) | 198 (73.2) | 73 (26.8) | 1.62 (1.12–2.36)* | |
| On average how many times do you wash your hands on a daily basis? | 0.252 | ||||
| <10 times | 405 (61.7) | 322 (79.5) | 83 (20.5) | 1.00 | |
| ≥10 times | 252 (38.3) | 190 (75.6) | 61 (24.4) | 1.25 (0.86–1.82) | |
Multiple logistic regression model (Table 4) revealed that participants aged ≥65 years who had not been vaccinated the previous year were 1.92 times more likely to increase their intent to vaccinate against the flu the following season than participants <65 years (OR=1.92; 95% CI: 1.00–3.67, p=0.049). Those believing that vaccination against the flu is a measure to prevent the spread of SARS-CoV-2 were 2.4 times more likely to express a positive change in their intent to vaccinate against the flu next season than those who were not (OR=2.37; 95% CI: 1.37–4.13, p=0.002). In contrast, those believing that SARS-CoV-2 was developed by humans in laboratories and those believing that COVID-19 will disappear when a large percentage of the population will be infected were 33% less likely and 56% less likely, respectively, to change their decision to vaccinate against the flu the following season (OR=0.67; 95% CI: 0.40–1.01 and OR=0.44; 95% CI: 0.24–0.78; p=0.006, respectively).
Table 4
Impact of factors on participants’ intension to vaccinate against the flu next season
| OR (95% CI)* | p | |
|---|---|---|
| Age (years) (≥65 vs <65) | 1.92 (1.00–3.67) | 0.049 |
| Knowledge of symptomsa | 1.54 (0.97–2.30) | 0.062 |
| Vaccination against the flu is considered a measure to prevent the spread of coronavirus (Reference: No) | ||
| Yes | 2.37 (1.37–4.13) | 0.002 |
| Don’t know | 0.76 (0.37–1.54) | 0.440 |
| Knowledge of the appropriate way of hand washing with soap and watera | 1.37 (0.90–2.07) | 0.141 |
| Belief that coronavirus was developed by humans in laboratories (Reference: No) | ||
| Yes | 0.67 (0.40–1.01) | 0.052 |
| Don’t know | 0.78 (0.44–1.40) | 0.406 |
| Belief that coronavirus is far more infectious compared to the flu virus H1N1 | 1.58 (0.87–2.88) | 0.134 |
| Belief that coronavirus is far more lethal compared to the flu virus H1N1 | 1.03 (0.61–1.75) | 0.899 |
| Belief that coronavirus will be eliminated when a large percentage of the population will be infected | 0.44 (0.24–0.78) | 0.006 |
| Belief that a new coronavirus outbreak is very likely | 1.34 (0.79–2.27) | 0.271 |
| Applying social distancing before government measures | 1.50 (0.98–2.28) | 0.066 |
DISCUSSION
The current study provides insights into the potential impact of the COVID-19 pandemic on the acceptance of influenza vaccination by the general population in Greece. We have identified several factors associated with a change of attitude towards the seasonal flu vaccination according to prior vaccination status and demographic characteristics and knowledge attitudes and practices against COVID-19.
According to our findings, a high percentage (66.3%) of respondents had not been vaccinated for seasonal influenza during the 2019–2020 season, the season prior to the COVID-19 pandemic, a percentage much lower than that in a previously conducted Greek study where 96.4% of the patients with idiopathic pulmonary fibrosis were immunized against influenza (530/550)21. Almost all (92.4%) of those that had been vaccinated were consistent in doing the same the upcoming flu season 2020–2021. However, this was not so for the non-vaccinated respondents, where 59.5% would not vaccinate again. In all, 21.8% were favorable in getting vaccinated the upcoming year and 18.8% were undecided at the time of the survey.
Factors independently associated with intention to vaccinate in the group of people that had not vaccinated the previous flu season were age ≥65 years (OR=1.92), belief that vaccination against the flu is considered preventive against the spread of the coronavirus (OR=2.37), not believing that coronavirus is lab-developed, and belief that the pandemic will come to an end when a large percentage of the population will be infected. A similar change in the intention to vaccinate for seasonal flu from refusal to acceptance or hesitancy has been shown in a study that was conducted in Italy22. In particular, 20.4% of the participants were highly influenced from the COVID-19 pandemic, which changed their willingness to be vaccinated in the 2020–2021 season.
As it has been shown that influenza vaccination can be an effective strategy to reduce the severity of the COVID-19 disease in the general population, it is imperative that flu vaccination promotion programs target specific populations and beliefs as presented above20.
Considering that there is no effective treatment against seasonal influenza, flu vaccination is the only measure with positive impact on influenza-related mortality, medical visits, hospitalizations, and healthcare costs23-25.
Limitations
A significant limitation of the results reported here is that the study was not originally designed to examine specifically the impact of the pandemic on flu vaccination, but was developed as a sub-analysis of a larger survey aiming to describe the knowledge, attitudes and practices of the general Greek public towards the virus and the pandemic. As such, we have missed out on questions that could explore the reasons for the observed change of intent and overall attitudes toward vaccination. Nevertheless, this analysis offers unique insights into factors that might influence seasonal flu vaccination uptake among the Greek population at the start of the global pandemic. It will be interesting to follow up how these may change over time and waves.
CONCLUSIONS
We have described how the COVID-19 pandemic can affect the intention of respondents to vaccinate against seasonal influenza among the Greek population. Factors associated with potentially shaping and increasing willingness to vaccinate against the flu can be used to design effective strategies to increase vaccination uptake in view of pandemics and independently.