


INTRODUCTION
The coronavirus disease (COVID-19) is an infectious disease, caused by the SARS-CoV-2 virus which attacks the lung parenchyma and is a systemic illness with a significant mortality rate1.The angiotensin-converting enzyme 2 receptor (ACE2) on lung cell membranes attaches to the viral spike protein, allowing viral entrance into the cells2. Patients with COVID-19 infection can present with no, mild or even with severe symptoms3.The thyroid gland is susceptible to COVID-19 infection because ACE2 receptors are present in the thyroid parenchyma3. Furthermore, Rotondi et al.4 found that thyroid follicular cells showed ACE2 receptor mRNA expression, which indicates that SARS-CoV-2 may target the thyroid gland. Low levels of serum T3 and/or thyroxine (T4) without an increase in thyroid-stimulating hormone (TSH) secretion are the hallmark of the Low T3 syndrome (LT3S), which has been linked to COVID-195-7. LT3S may be the organism’s reaction to stress and lack of macronutrients. It is also linked to major consequences like mortality, especially in people who are critically ill. Interleukin-6 (IL-6) and TNF-α are the two cytokines that most frequently have an impact on the thyroid’s function8. Considering that IL-6 and TNF-α are particularly important in the cytokine storm related to COVID-19 infection9, their increase is most likely the reason why FT3 levels are lowered in critically ill patients with COVID-19 infection9. Furthermore, it was observed that the hypothalamus-pituitary-thyroid axis can also be altered by a number of mediators, notably those that primarily affect the regulation and production of hormones, such as IL-1 and IFN-γ10-12. Additionally, it has been noted that prior to the onset of relapse in COVID-19 infected individuals, inflammatory cytokine levels rise and FT3 levels relatively drop12.
Recognizing the thyroid hormone variations in severely ill patients will probably help physicians diagnose the disease and predict the outcome13. In particular, not enough studies have been conducted on how LT3S emerged during the COVID-19 epidemic. The purpose of the current study was to demonstrate that mortality and the severity and the risk of intubation are associated with the onset of LT3S in patients with COVID-19 infection during their admission to the ICU. However, serum T3 levels might be altered by smoking14. Therefore, this study also aimed to find how smoking affects mortality in patients with LT3S.
METHODS
This retrospective study included 105 patients admitted to the Intensive Care Unit of the 1st Department Respiratory Medicine in ‘Sotiria’ Hospital, in Greece, between January 2021 and October 2021. Data were retrieved from electronic patients’ medical records.
Participants were laboratory-confirmed (RT-PCR) patients with COVID-19, aged ≥18 years
The following were listed as exclusion criteria: 1) underlying primary thyroid disease; 2) history of chemotherapy or radiotherapy within the previous six months; 3) underlying disease of the hypothalamus or pituitary gland; and 4) patients taking medications known to affect thyroid function, such as lithium, glucocorticoids, or amiodarone; and 5) patients who had been administered corticosteroids before their admission in the ICU. Serum FT3 values <2.3 pg/mL and low or normal TSH levels were used to define LT3S. Patients were divided into two groups according to serum FT3 values: a group with LT3S and a group without LT3S. The values of total T3, free T3, total T4, free T4 and TSH were recorded on the first day of their admission to the ICU and on the last day of their hospitalization in the ICU. We analyzed the data between patients with and without LT3S based on gender, age, comorbidities, and mortality.
Statistical analysis
Descriptive statistics for the study variables were estimated separately in the LT3S versus non LT3S groups; median values and interquartile range (IQR) were calculated. In view of deviation from normality (as evidenced by the Shapiro-Wilk test), Mann-Whitney-Wilcoxon test was performed to evaluate differences in continuous variables between the two groups. Differences in categorical variables between the two groups were evaluated with Pearson’s chi-squared test or Fisher’s exact test, as appropriate. Univariate and multivariate Cox regression analysis was performed to evaluate the associations between the various predictors (WBC count, lymphocyte count, PCT, serum CRP, ferritin, troponin, urea, SGOT, SGPT, HR, RR, SBP, SOFA score, APACHE II score) and intubation risk. Statistical analysis was performed using Stata/SE 16 (Stata Corp., College Station, TX, USA).
RESULTS
A total of 105 patients were included in the study; 43 patients were diagnosed with LT3S with median age of 62 years [IQR (Q1–Q3): 13.7 (55–68.7)] and 62 patients were found without LT3S with median age of 52.8 years [IQR: 15.5 (47–62.5)]; and 29 males and 14 females were enrolled in the LT3S group and 50 males and 12 females in the non LT3S group. Regarding the smoking habit, 41 of the patients without LT3S were never smokers, 3 were ex-smokers and 18 were active smokers. In the LT3S group, 25 were never smokers, 5 were ex-smokers, and 13 were current smokers.
Table 1 shows the differences between the two groups (LT3S vs Non LT3S). Patients in the LT3S group were older than those without LT3S [median (IQR), 62 (13.7) vs 52.8 (15.5), p =0.011].
Table 1
Study variables in the Low T3 syndrome versus non Low T3 syndrome groups
| Continuous variables | Non Low T3 syndrome (N=62) Median (IQR; Q1–Q3) | Low T3 syndrome (N=43) Median (IQR; Q1–Q3) | p* |
|---|---|---|---|
| Age (years) | 52.8 (15.5; 47–62.5) | 62 (13.7; 55–68.7) | 0.011 |
| Duration of symptoms before admission (days) | 6.5 (4; 4–8) | 7 (4; 5–9) | 0.064 |
| WBC count | 8760 (6100; 6390–12490) | 10570 (9330; 6390–15720) | 0.198 |
| Lymphocytes | 790 (460; 540–1000) | 650 (570; 450–1020) | 0.36 |
| Neutrophils | 7390 (5720; 4580–10300) | 8510 (8610; 4870–13480) | 0.086 |
| Eosinophils | 0 (10; 0–10) | 10 (10; 0–10) | 0.169 |
| Monocytes | 430 (310; 290–600) | 450 (350; 310–660) | 0.469 |
| Hematocrit (%) | 41.2 (5.4; 38.6–44) | 40.1 (5.4; 36.4–41.8) | 0.122 |
| Hemoglobin (g/dL) | 13.4 (2.3; 12.2–14.5) | 12.9 (2.4; 11.7–14.1) | 0.18 |
| Platelets | 220950 (128000; 187000–315000) | 246800 (147200; 191400–338600) | 0.299 |
| PCT | 0.085 (0.125; 0.05–0.175) | 0.08 (0.17; 0.05–0.22) | 0.702 |
| CRP | 6.89 (7.49; 3.69–11.18) | 8.42 (11.28; 3.72–15) | 0.519 |
| Ferritin | 866.9 (1006.3; 489.7–1496) | 1135 (1315.1; 514.9–1830) | 0.544 |
| D-dimers | 0.985 (1.1; 0.59–1.69) | 0.81 (1.91; 0.54–2.45) | 0.848 |
| Fibrinogen | 577 (167; 494–661) | 543 (236; 454–690) | 0.346 |
| Troponin | 5.65 (13.9; 2.8–16.7) | 9.3 (18.1; 3.8–21.9) | 0.13 |
| Creatinine | 0.85 (0.3; 0.7–1) | 0.9 (0.4; 0.8–1.2) | 0.085 |
| Urea | 45.5 (25; 36–61) | 52 (21; 44–65) | 0.029 |
| Albumin | 3.6 (0.45; 3.3–3.75) | 3.35 (0.6; 3.1–3.7) | 0.066 |
| SGOT | 36 (28; 26–54) | 43 (31; 30–61) | 0.126 |
| SGPT | 39.5 (42; 27–69) | 43 (50; 29–79) | 0.446 |
| G-GT | 60.5 (49; 35–84) | 73 (75; 39–114) | 0.122 |
| AlP | 54 (26; 40–66) | 55 (25; 49–74) | 0.112 |
| CK | 133 (166; 73–239) | 84 (104; 52–156) | 0.017 |
| Potassium | 4.1 (0.6; 3.9–4.5) | 4.3 (0.8; 3.9–4.7) | 0.174 |
| Sodium | 137.5 (3; 136–139) | 139 (5; 136–141) | 0.265 |
| Total bilirubin | 0.6 (0.5; 0.4–0.9) | 0.6 (0.7; 0.4–1.1) | 0.465 |
| TSH | 0.54 (0.54; 0.33–0.86) | 0.32 (0.79; 0.14–0.93) | 0.052 |
| FT4 | 1.07 (0.24; 0.97–1.21) | 0.97 (0.2; 0.91–1.11) | 0.023 |
| FT3 | 1.86 (0.28; 1.72–1.99) | 1.4 (0.38; 1.16–1.54) | <0.0001 |
| pO2 | 83 (35.7; 68.1–103.8) | 86 (45.3; 65.1–110.4) | 0.94 |
| pCO2 | 37.4 (8.3; 33.7–42) | 36 (15; 31–46) | 0.294 |
| pH | 7.46 (0.08; 7.41–7.49) | 7.45 (0.14; 7.36–7.5) | 0.547 |
| Bicarbonate | 25.35 (5.15; 23.85–29) | 25 (5.5; 22.5–28) | 0.516 |
| FiO2 | 1 (0.15; 0.85–1) | 0.99 (0.2; 0.8–1) | 0.378 |
| PaO2/FiO2 | 90 (51; 69–120) | 100 (69; 75–144) | 0.544 |
| aagrad | 539.3 (114; 469–583) | 521.5 (178.9; 402.6–581.5) | 0.362 |
| HR | 86 (22.5; 77–99.5) | 86 (18; 77–95) | 0.957 |
| RR | 24 (7; 20–27) | 22.5 (8; 18–26) | 0.651 |
| Body temperature | 36.6 (0.5; 36.5–37) | 36.7 (0.5; 36.5–37) | 0.741 |
| SBP | 135 (22; 126–148) | 128 (25; 110–135) | 0.003 |
| DBP | 79 (15; 70–85) | 78 (14; 70–84) | 0.725 |
| MAP | 95.3 (15.8; 90–105.8) | 93.3 (15; 85–100) | 0.077 |
| GCS | 15 (12; 3–15) | 15 (12; 3–15) | 0.289 |
| qSOFA | 1 (2; 0–2) | 1 (2; 0–2) | 0.576 |
| SOFA | 3 (4; 2–6) | 6 (5; 2–7) | 0.311 |
| APACHE | 9 (7; 7–14) | 13 (15; 8–23) | 0.079 |
| Length of hospital stay (days) | 31 (26; 20–46) | 30 (65; 22–87) | 0.555 |
| Length of ICU stay (days) | 13 (25; 7–32) | 12 (62; 5–67) | 0.812 |
| Categorical variables | Non Low T3 syndrome (N=62) n (%) | Low T3 syndrome (N=43) n (%) | p |
| Gender | 0.123† | ||
| Male | 50 (80.7) | 29 (67.4) | |
| Smoking status | 0.397‡ | ||
| Never smoker | 41 (66.1) | 25 (58.1) | |
| Ex-smoker | 3 (4.8) | 5 (11.6) | |
| Current smoker | 18 (29.0) | 13 (30.2) | |
| Outcome | 0.080† | ||
| Death | 11 (17.7) | 14 (32.6) |
As expected, FT4 and FT3 levels were lower in the LT3S group than in the non LT3S group (p=0.023 and p<0.0001, respectively). In addition, systolic blood pressure was lower in the LT3S group versus the non LT3S group [median 128 (25; 110–135) vs 135 (22; 126–148) mmHg, p=0.003]. In contrast, the levels of CRP [median 8.42 (11.28; 3.72–15) vs 6.89 (7.49; 3.69–11.18) mg/dL, p=0.519], and procalcitonin [median 0.08 (0.17; 0.05 to 0.22) vs 0.085 (0.125; 0.05 to 0.175) ng/mL, p=0.702], the lymphocyte count [650 (570; 450 to 1020) vs 790 (460; 540 to 1000), p=0.36], ferritin levels [median 1135 (1315.1; 514.9–1830) vs 866.85 (1006.3; 489.7–1496) ng/mL, p=0.544) and D-Dimers [median 0.81 (1.91; 0.54–2.45) vs 0.985 (1.1; 0.59–1.69) μg/mL, p=0.848] did not have statistically significant difference between the two groups. Additionally, as far as the SOFA and APACHE scores were concerned, no statistically significant difference was observed (Table 1).
Regarding the mortality rate, non-statistically significantly higher mortality was observed in the LT3S group compared to the non LT3S group (32.6% vs 17.7%, p=0.080).
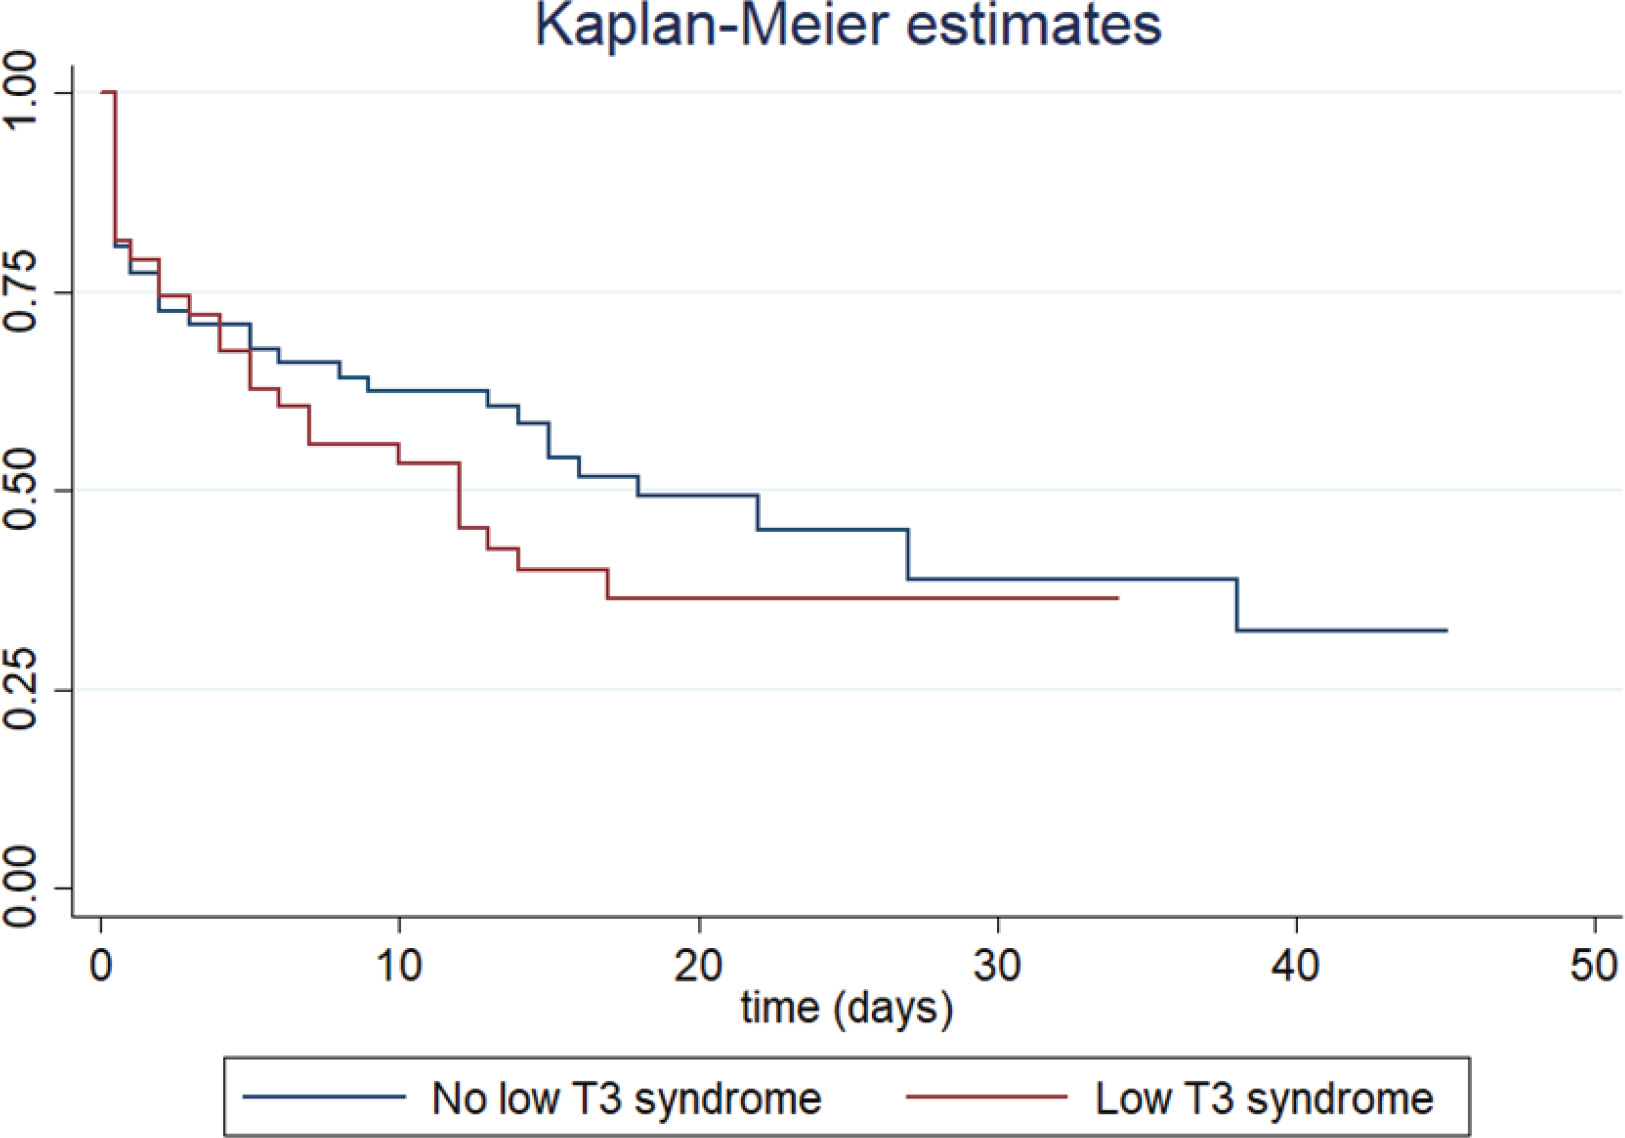
Table 2 presents the results of the univariate Cox regression analysis examining the relationship between study variables and risk of intubation. LT3S was not associated with an increased risk of intubation (HR=1.32; 95% CI: 0.78–2.22). The Kaplan-Meier curve is shown in Figure 1. In contrast, intubation was significantly associated with white blood cell (WBC) count, procalcitonin (PCT), serum ferritin, serum troponin, serum urea, respiratory rate, systolic blood pressure (inverse correlation), SOFA and APACHE II scores.
Table 2
Univariate Cox regression analysis examining the association between study variables and intubation risk
However, in the subgroup of never smokers with LT3S, higher mortality was observed compared to never smokers without LT3S (40% vs 17.1%, p=0.039).
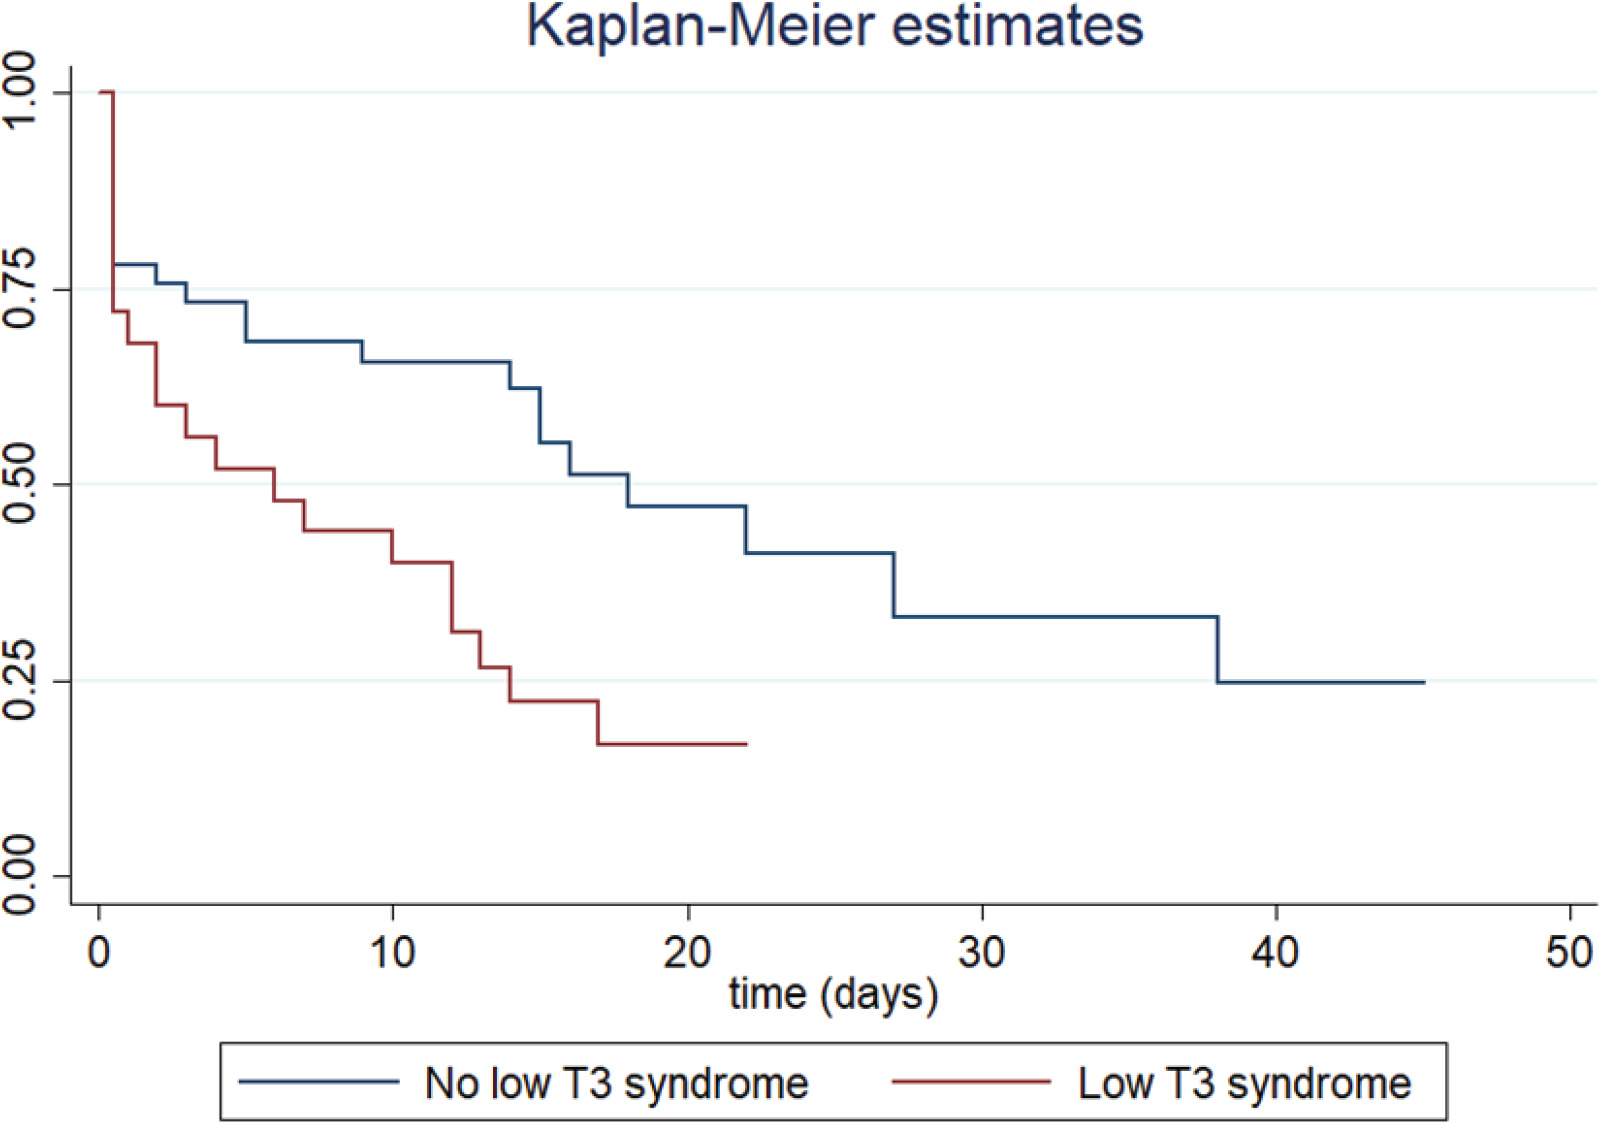
Finally, as shown in Table 3, LT3S in the never smoker subgroup was associated with an increased risk of intubation (HR=2.21; 95% CI: 1.18–4.16). The Kaplan-Meier curve is shown in Figure 2. Also, the risk of intubation was associated with white blood cell (WBC) count, procalcitonin (PCT), serum troponin, serum urea, respiratory rate, systolic blood pressure (inverse correlation), SOFA and APACHE II scores.
Table 3
Univariate Cox regression analysis examining the association between study variables and intubation risk; analysis in the subgroup of non-smokers
DISCUSSION
In our study, 43 out of 105 critically ill patients presented with LT3S. FT4 and FT3 levels were lower in the LT3S group than in the non LT3S group. There was no statistically significantly higher mortality in the LT3S group compared to the non LT3S group. Furthermore, the LT3S was not associated with an increased risk of intubation. However, it was noticed that the subgroup of never smokers with LT3S, had higher mortality rate compared to never smokers without LT3S and that LT3S in the never-smoker subgroup was associated with an increased risk of intubation and higher SOFA and APACHE II scores.
It is reported that critically ill patients with COVID-19 infection who died had greater FT3 concentrations and lower plasma T4, T3, and TSH concentrations than patients who leave the hospital15. Patients with LT3S experienced more severe disease and worse outcomes than those without LT3S in a retrospective study of 41 participants with COVID-19 infection16.
Patients with COVID-19 infection, particularly those with more severe disease, have frequently been described as having the so called ‘cytokine storm’, which is a systemic inflammation defined by the excessive production of inflammatory mediators17. However, in our research, the inflammatory response did not seem to be stronger in patients with LT3S, as CRP, procalcitonin, lymphocyte count, D-Dimers and ferritin did not seem to be higher in the LT3S group. In contrast, Zou et al.16 found that patients with LT3S had considerably greater levels of erythrocyte sedimentation rate, CRP, and procalcitonin, whereas their lymphocyte counts appeared to be lower.
Moreover, interestingly in our study, although there was a trend for higher mortality in LT3S group this was not statistically significant compared to non LT3S group (32.6% vs 17.7%, p=0.080). The small size of our sample could possibly explain this finding. Additionally, it was not demonstrated that LT3S was linked to a higher incidence of intubation. However, in the cohort of never smokers, patients with LT3S had statistically significantly higher mortality than those without LT3S, as well as an increased risk of intubation.
We aimed to highlight research concentrating on the link between smoking and LT3S in COVID-19 patients considering the consequences caused by smoking in individuals with viral infections18. Moreover, smoking has long been known to have an impact on thyroid function, which may be related to exposure to toxic metabolites, increased sympathetic nerve activity, or thyroid-focused autoimmune responses14. The above are the reasons why the smoking habit was chosen as a variable for subgroup analysis. Smoking and COVID-19 are linked, but the link is currently debatable. Active smokers are said to have a lower chance of being infected than never smokers19. Additionally, there is a theory that suggests nicotine may protect COVID-19 patients from life-threatening disease. Of course, this theory needs more research to be confirmed20. In contrast, a study by Kashyap et al.18 shows that hospitalized patients with COVID-19 who smoke actively have more severe disease and a greater mortality rate. Additionally, Monteiro et al.21 reported that individuals with COVID-19 disease were more likely to require intubation when they had a history of smoking. One possible explanation may be that smoking may interfere with the ACE-2 receptor, which SARS-CoV-2 uses and initiate the ‘cytokine storm’18. Studies suggest that hospitalized patients smoke more frequently than they disclose, so it should be kept in mind that patients frequently lie about their smoking habits22.
Limitations
Our study has some limitations. First, thyroid function data were only gathered when patients were admitted and when they were discharged from the intensive care unit. Second, the sample size was modest, especially the subgroups of ex-smokers and active smokers, hence multicenter investigations with more participants are required. It should also be noted that the lack of association between LT3S and mortality among ex-smokers or active smokers might be due to small numbers and it should be further investigated. Moreover, other characteristics such as alcohol consumption, co-morbidities, and vaccination history were not investigated as risk factors for adverse outcomes in patients with LT3S. Finally, pituitary function and glucocorticoid levels were not evaluated.
CONCLUSIONS
Approximately 41% of patients with COVID-19 infection were diagnosed with LT3S in our study. These patients did not have an increased risk of intubation or higher mortality, at least with a statistically significant difference. However, the subgroup of never smokers with LT3S was found to have an increased risk of intubation and higher mortality. To establish the impact of LT3S in critically ill patients with COVID-19 infection as well as the impact of smoking in the development of the syndrome, additional research with a larger sample size and proper study design is required.