

INTRODUCTION
Chronic obstructive pulmonary disease (COPD), a chronic inflammatory disease leading to irreversible airflow limitation, is the third leading cause of death and a substantial source of disability, worldwide1. Acute exacerbations of COPD (AECOPD) contribute at large to the progressive decline in the quality of life and the functional status of these patients2. Moreover, moderate to severe AECOPD may lead to respiratory failure, requiring invasive mechanical ventilation and admission to the intensive care unit (ICU). Critically ill patients with AECOPD admitted to the ICU have significantly higher rates of morbidity and mortality compared to patients hospitalized for AECOPD but not requiring ventilatory support3-7. The severity of the disease per se, the co-existence of multiple co-morbidities, as well as the ICUrelated complications may justify, in part, this fact8-11.
Infectious exacerbations or end-stage disease have been identified as major causes of ICU admittance12-14. As yet, many studies have attempted to identify independent predictors of the outcomes of these patients in the ICU, however, the results are not consistent across studies, except for Acute Physiology and Chronic Health Evaluation (APACHE)-II score which seems to have a reproducible effect15-18. The decision for initiating ventilatory support in patients with severe COPD may sometimes become a subject of disagreement among the clinicians that take care of these patients12,18,19. Therefore, the identification of clinical or laboratory characteristics that may predict the outcomes of mechanically ventilated patients with COPD admitted to the ICU for an AECOPD is of importance.
The aim of this study was to describe the characteristics and outcomes of patients with infectious AECOPD requiring invasive mechanical ventilation in the ICU of a referral hospital for respiratory diseases. We also sought to identify independent prognostic variables associated with 28-day ICU mortality.
METHODS
This was a retrospective observational cohort study of 127 patients with AECOPD admitted to the University ICU, at ‘Sotiria’ Hospital, in Athens, Greece, between December 2013 and December 2018. Patients who were admitted for the management of any other condition and had COPD as a known co-morbidity were not included in the study. Data were extracted from the electronic medical records of the ICU database. Demographic data included age, sex, body mass index (BMI), smoking status, and comorbidities. Furthermore, long-term oxygen therapy (LTOT) and noninvasive ventilation (NIV) at home on the basis of chronic hypercapnic respiratory failure, prior maintenance COPD treatment, number of exacerbations/hospitalizations in the previous year, pulmonary function test results during the previous year, and vaccination history were included. Scores of Sequential Organ Failure Assessment (SOFA), Acute Physiology and Chronic Health Evaluation-II (APACHE-II), and Charlson Comorbidity Index (CCI), were also recorded. Other laboratory variables measured upon admission included C-reactive protein (CRP), procalcitonin (PCT), lactate, neutrophil/lymphocyte ratio (NLR), creatinine, and albumin. Finally, hospital and ICU length of stay (LOS), and mortality were recorded as outcome measures. The mortality assessment was done at 28 days from ICU admission. The study was approved by the ‘Sotiria’ hospital Ethics committee (Approval number: 17543). Patients’ consent to review their medical records was not required by the Ethics committee since this was an observational retrospective study. Patients’ data confidentiality was preserved in compliance with the Declaration of Helsinki.
Statistical analysis
Categorical variables were analyzed with Fisher’s exact test. Continuous variables were analyzed with independent samples t-test or Mann-Whitney test. Normality was assessed with Kolmogorov-Smirnov test. Logistic and linear regression models were fitted as appropriate. Model fit was assessed by checking plots of residuals. Kaplan-Meier curves were built for 28-day survival and log-rank test was used for comparisons. Data analysis was performed with SPSS 17.0 (IBM Corporation, NY, 2008). For all analyses, alpha was set at 0.05 (2-sided).
RESULTS
Demographic data
One hundred and twenty-seven patients were admitted to the University affiliated respiratory ICU, in ‘Sotiria’ Hospital due to acute COPD exacerbation (AECOPD) during the study period. They were all on mechanical ventilation upon admission. The mean age of the patients was 69±9 years (mean±SD), with the majority males (86/128, 67%). Forty-nine percent (62 patients) were current smokers, and 48% had at least one moderate to severe exacerbation in the previous year (Table 1). The commonest cause of COPD exacerbation was lower respiratory tract infection (78% of patients) followed by pneumonia (35%). Our study population had a mean FEV1 of 37±23% of the predicted value, based on the most recent lung function tests in the previous year, while 42.5% were on LTOT. Interestingly, 40% of the patients were not on maintenance therapy at home and were first diagnosed with COPD on the occasion of the current exacerbation. The rest of the patients were on inhaled therapy with longacting muscarinic antagonists (LAMA) (23%), LAMA/LABA (long acting b2 agonists) combination (15%) and on LAMA/LABA/ICS (inhaled corticosteroid) combination (22%) (Table 1). Two patients were on oral steroids (12.5 mg prednisolone, on average). The commonest co-morbid conditions related to the cardiovascular system (coronary artery disease 54%, heart failure 38%, and arterial hypertension 51%), followed by chronic renal failure (46.5%). The mean comorbidity index CCI was 5.8±2. The demographic data of the study group are shown in Table 1.
Table 1
Patients’ characteristics, differences between surviving and deceased patients (N=127)
Thirty-five percent of the patients (n=45) died in the ICU. These patients were significantly older than survivors (73±8 vs 67±8 years, p<0.001), had significantly lower BMI (kg/m2) (25±4 vs 32±7, p=0.04), had significantly more comorbidities compared to survivors (CCI: 7.4±1.6 vs 5.0±1.8, p<0.001), and more severe COPD (FEV1: 32±18 vs 57±24, p=0.03, more exacerbations in the previous year: p<0.012, exacerbations requiring hospitalization: 4.4±5 vs 1.9±5, p=0.001) (Table 1).
In our study, deceased patients had worse health status compared to survivors upon admission in the ICU, as they had significantly higher APACHE II score (29.9±6.5 vs 21.6±7.2, p<0.001), most suffered from sepsis (66.7% vs 2.4%, p<0.001), and multi-organ failure (MOF) (62.2% vs 1.2%, p<0.001), had significantly worse renal function [serum creatinine: median (IQR) 2.1 (1.2–2.4) vs 1.2 (0.8–1.4), p<0.001], significantly higher white blood cell counts (17508/mm3 vs 12918/mm3, p=0.001), significantly higher PCT (1.3±1.1 vs 0.93±0.97 ng/mL, p=0.042), and lactic acid (2.2 mEq/L (1.3–3.4) vs 1.1 mEq/L (0.9–1.4), p<0.001), and significantly lower pH and HCO3 - (7.32±0.11 vs 7.35±0.08, p=0.043 and 23.8±6 vs 26.6±5.2, p=0.007, respectively) (Table 2).
Table 2
Differences in physiological and laboratory indices between deceased and surviving patients (N=127)
[i] IQR: interquartile range. APACHE II: Acute Physiology and Chronic Health Evaluation-II score. SOFA: sequential organ failure assessment. MOF: multiorgan failure. VAP: ventilator associated pneumonia. IMV: invasive mechanical ventilation. ICU LOS: intensive care unit length of stay. CRP: C-reactive protein. PCT: procalcitonin. WBC: white blood cells. NLR: neutrophil/lymphocyte ratio. Hbg: haemoglobin. PEEP: positive end expiratory pressure. Lac: lactic acid.
These patients spent more time in the ward on mechanical ventilation compared to survivors before their ICU admission (15±22 vs 9±16 hours, p=0.02) (Table 2). Nevertheless, there were no differences in ICU LOS and length of mechanical ventilation between the groups (Table 2).
Univariate logistic regression revealed significant probability of ICU mortality in older (OR=1.10 per year increase, 95% CI: 1.05–1.17, p<0.001) male patients (OR=2.56; 95% CI: 1.09–6.02, p=0.031), with more comorbidities (CCI: OR=2.15 per unit increase, 95% CI: 1.63–2.83, p<0.001), with advanced disease stage (GOLD stage 4 vs all other stages: OR=27.5, 95% CI: 7.53–100.6, p<0.001), more exacerbations in the previous year (OR=2.04; 95% CI: 1.23–3.38, p<0.006), and exacerbations requiring hospitalization (OR=1.08; 95% CI: 1.01–1.16, p<0.029) (Table 3). Likewise, patients with worse health status upon admission in ICU (as reflected by APACHE II score, the presence of septic shock, the severity of respiratory and renal failure, and the presence of lactic acidosis) had a significant probability of 28-day ICU mortality.
Table 3
Univariable logistic regression for mortality in the ICU (N=127)
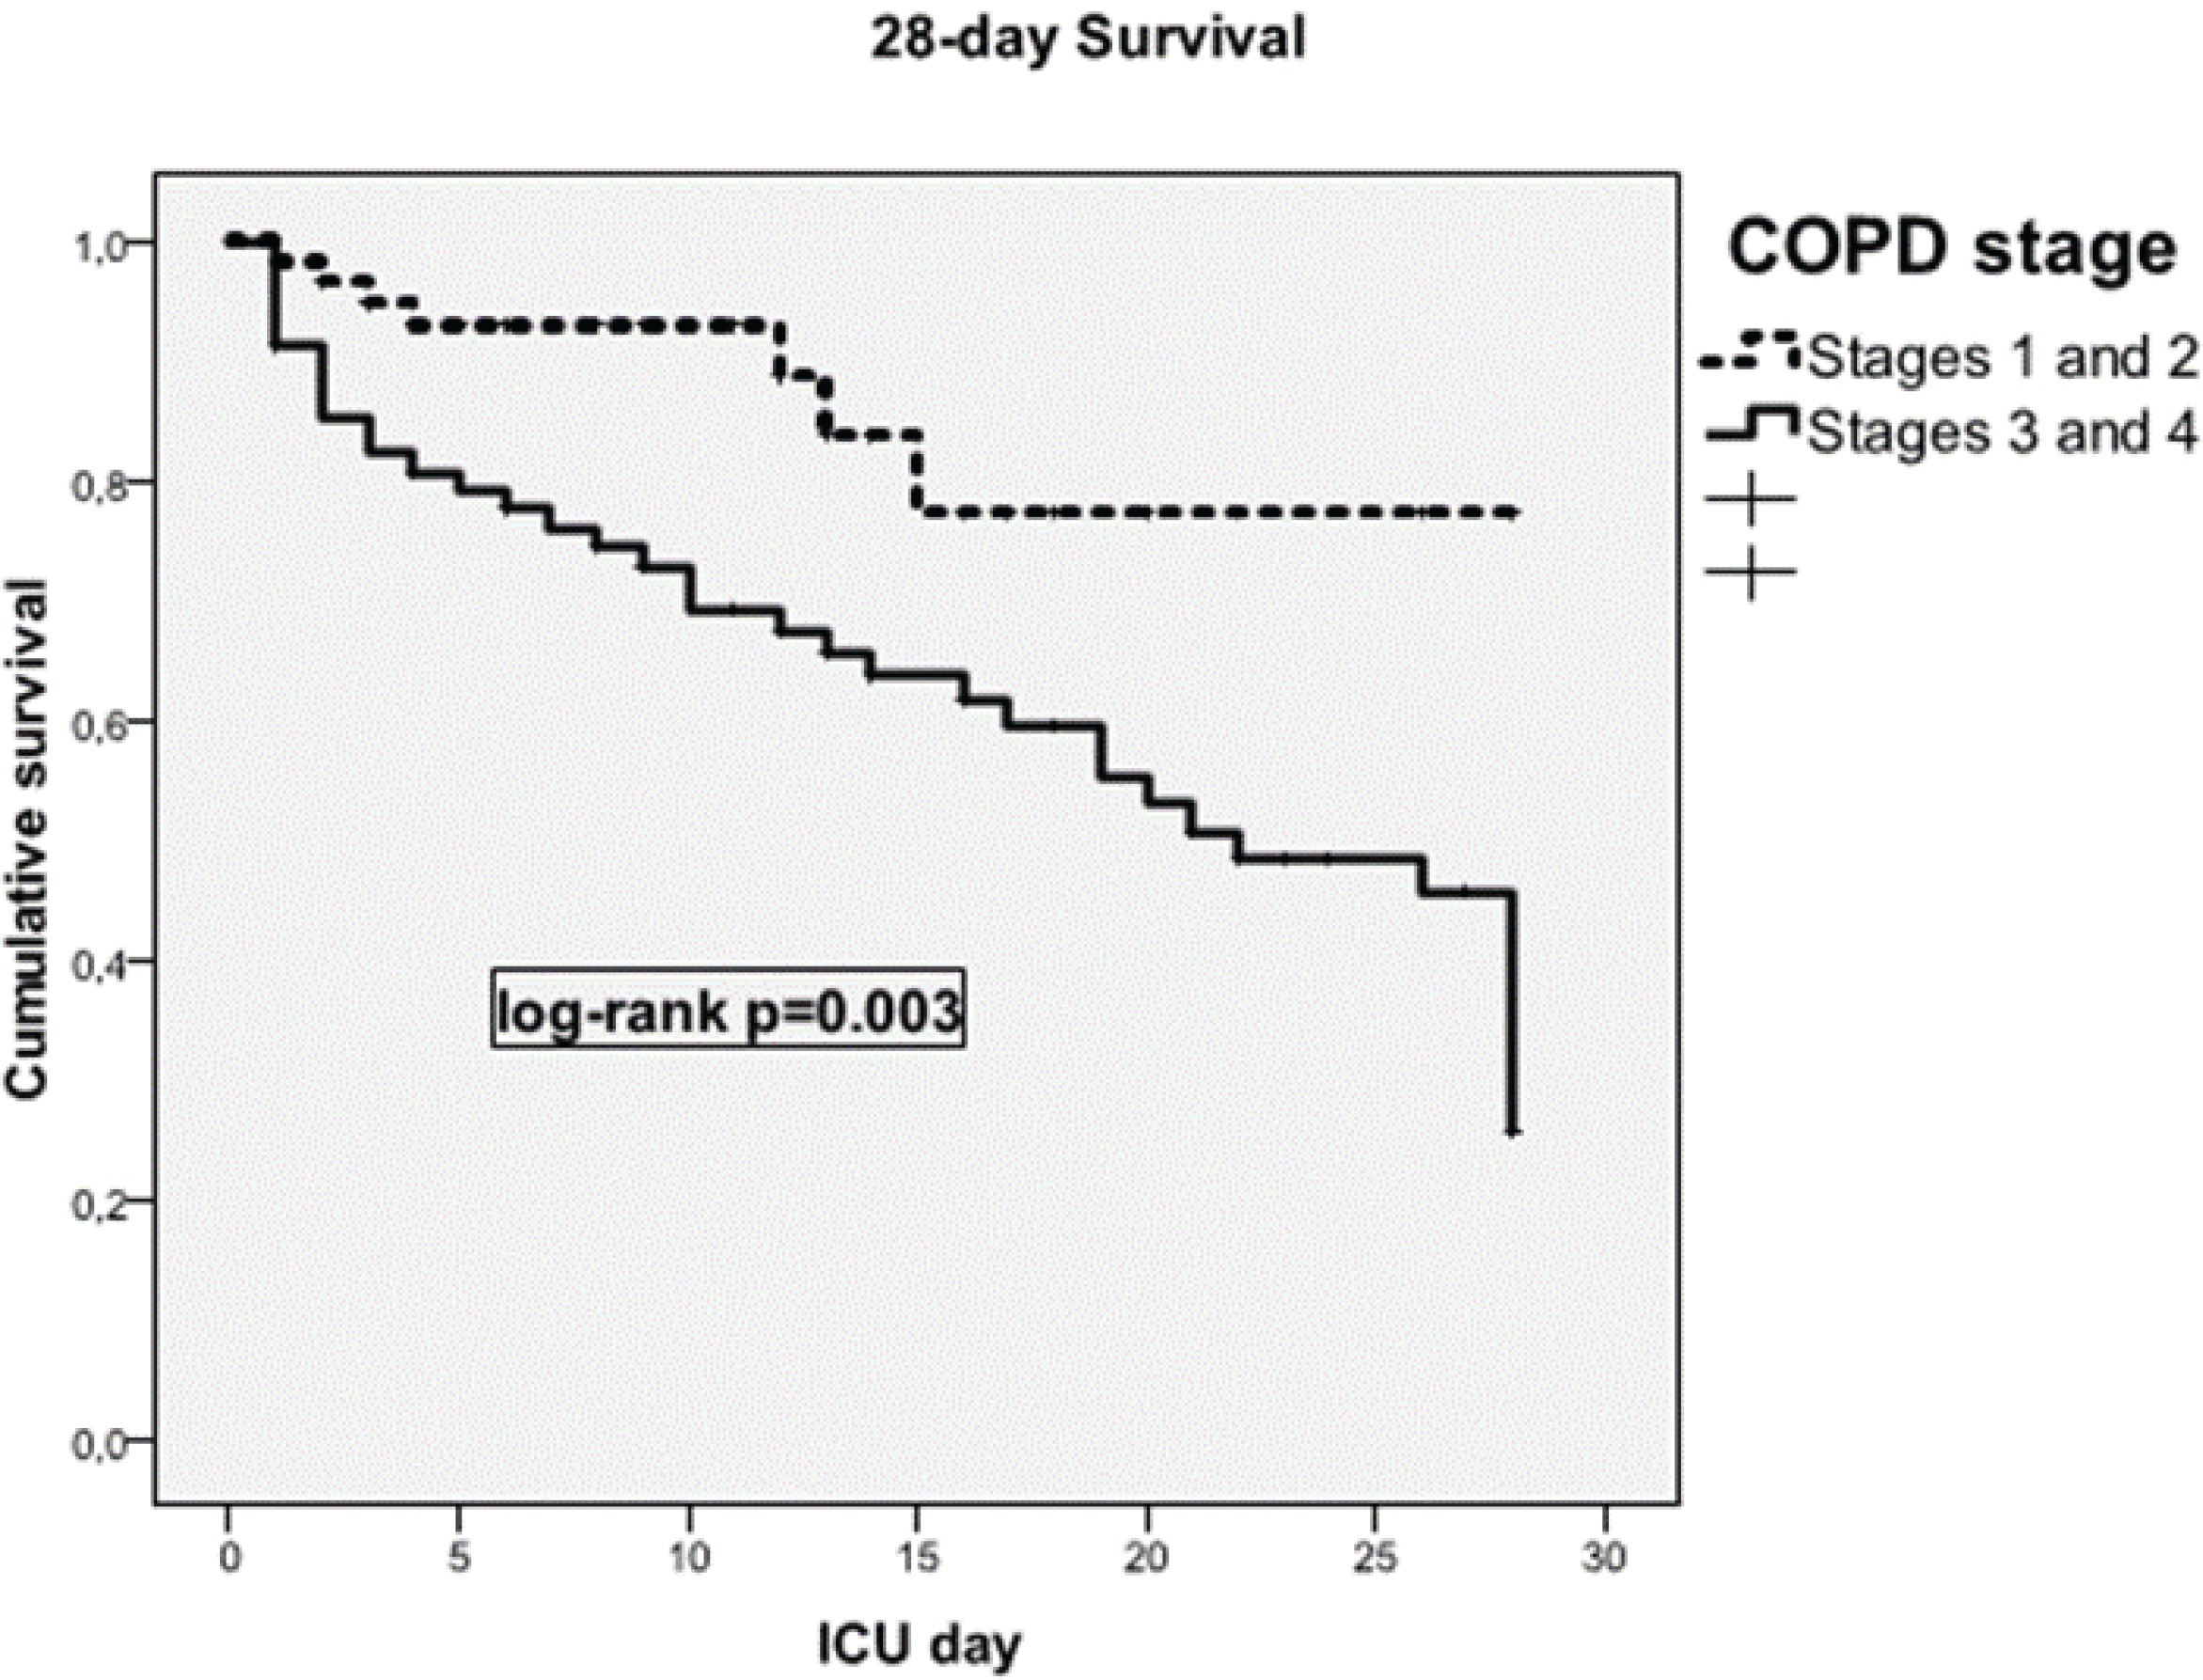
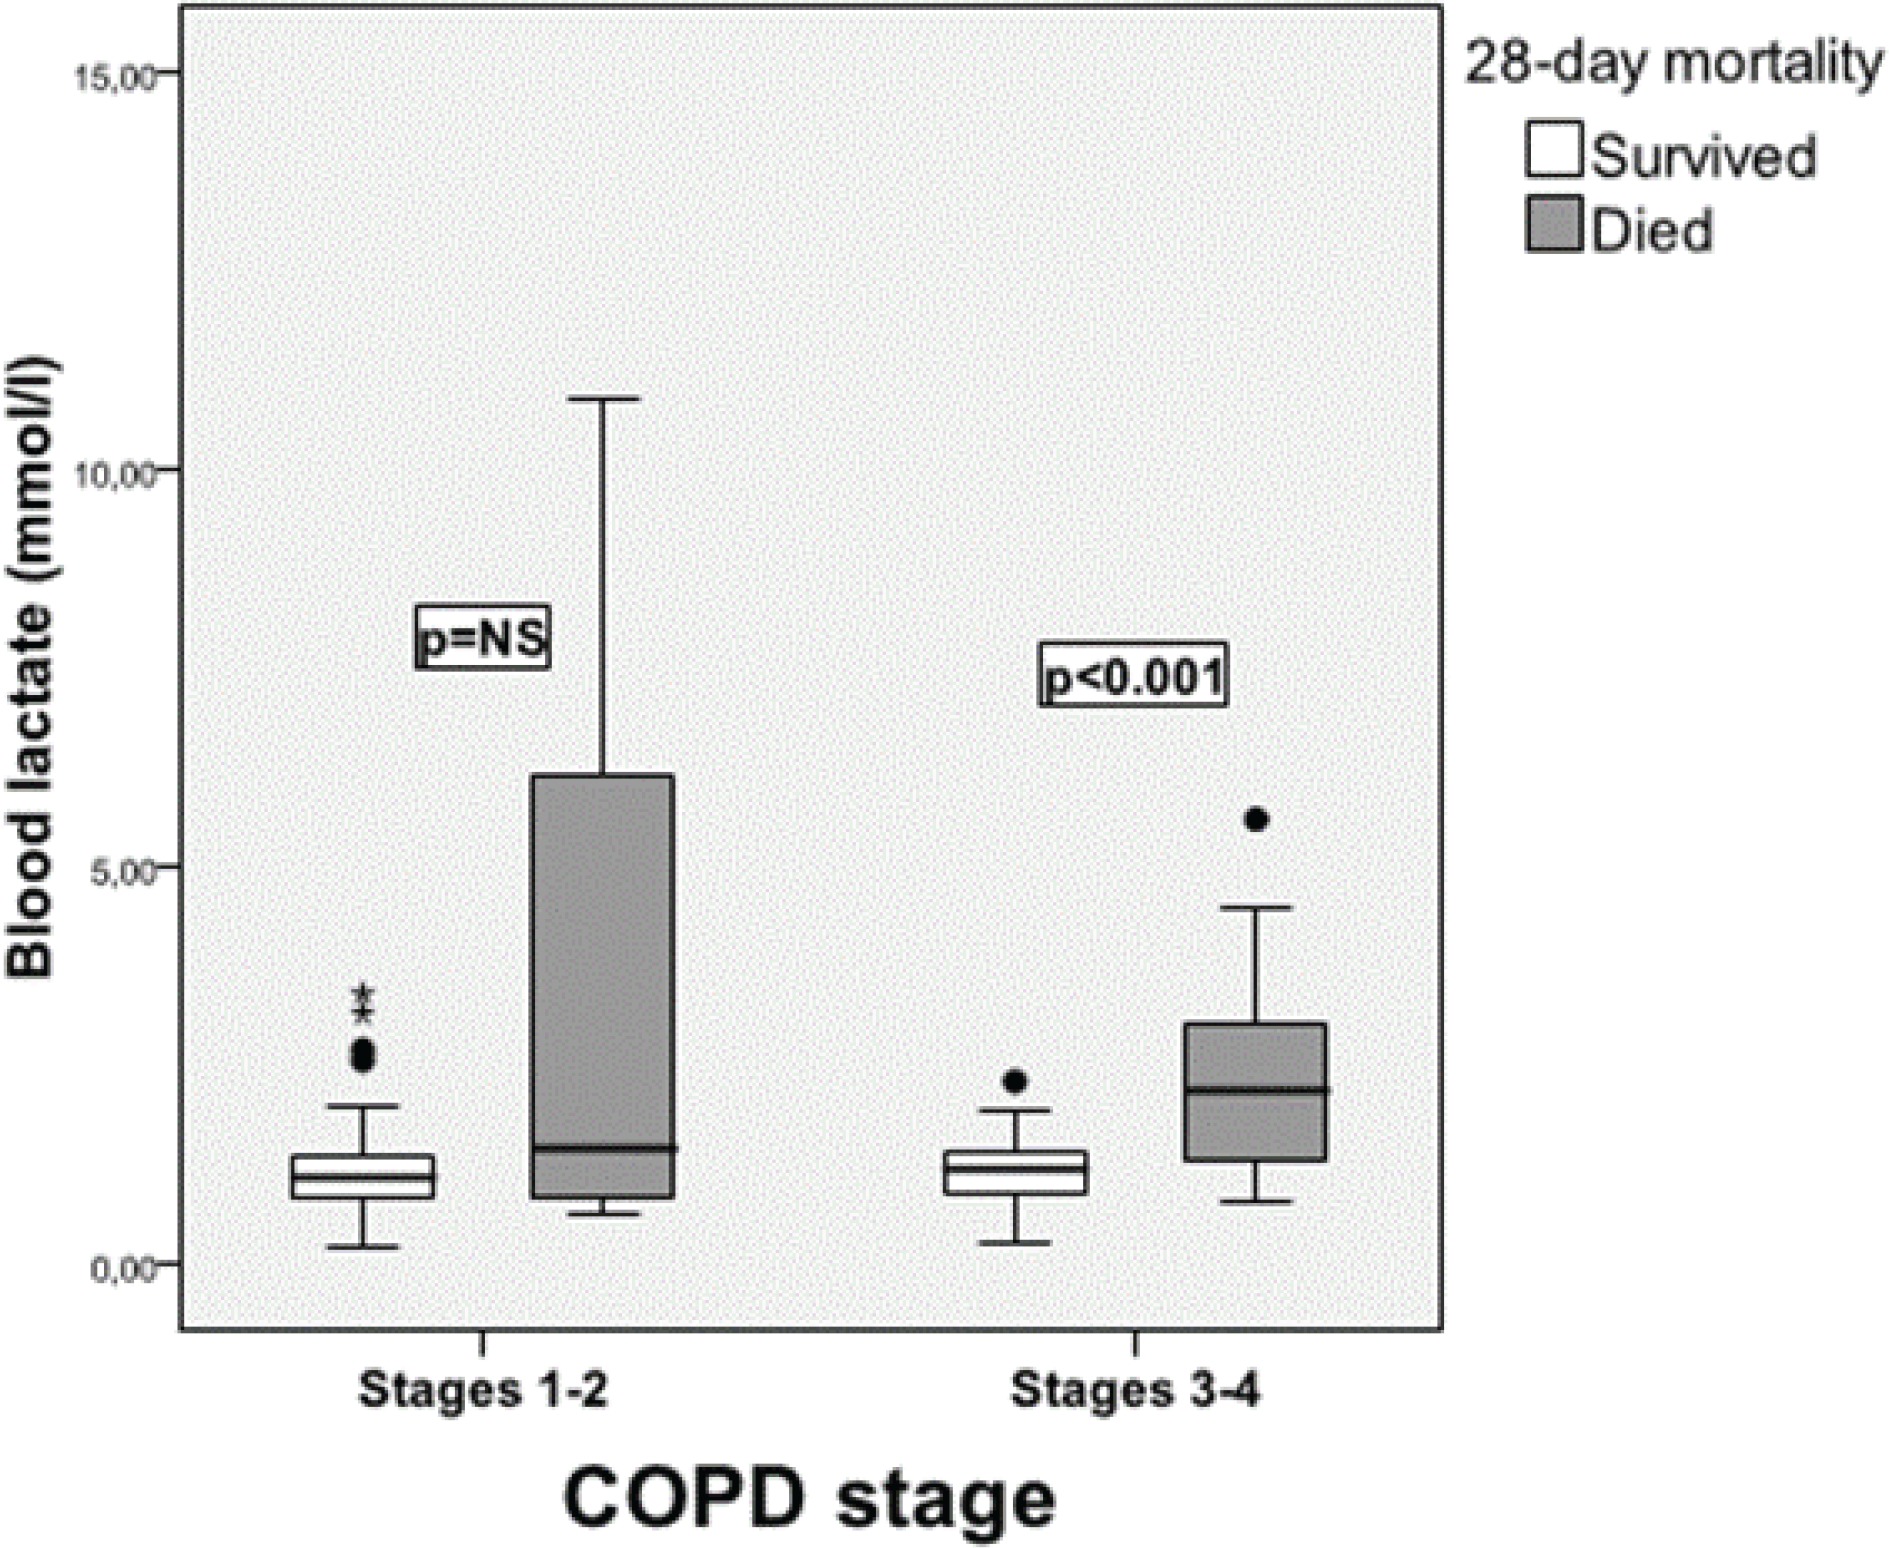
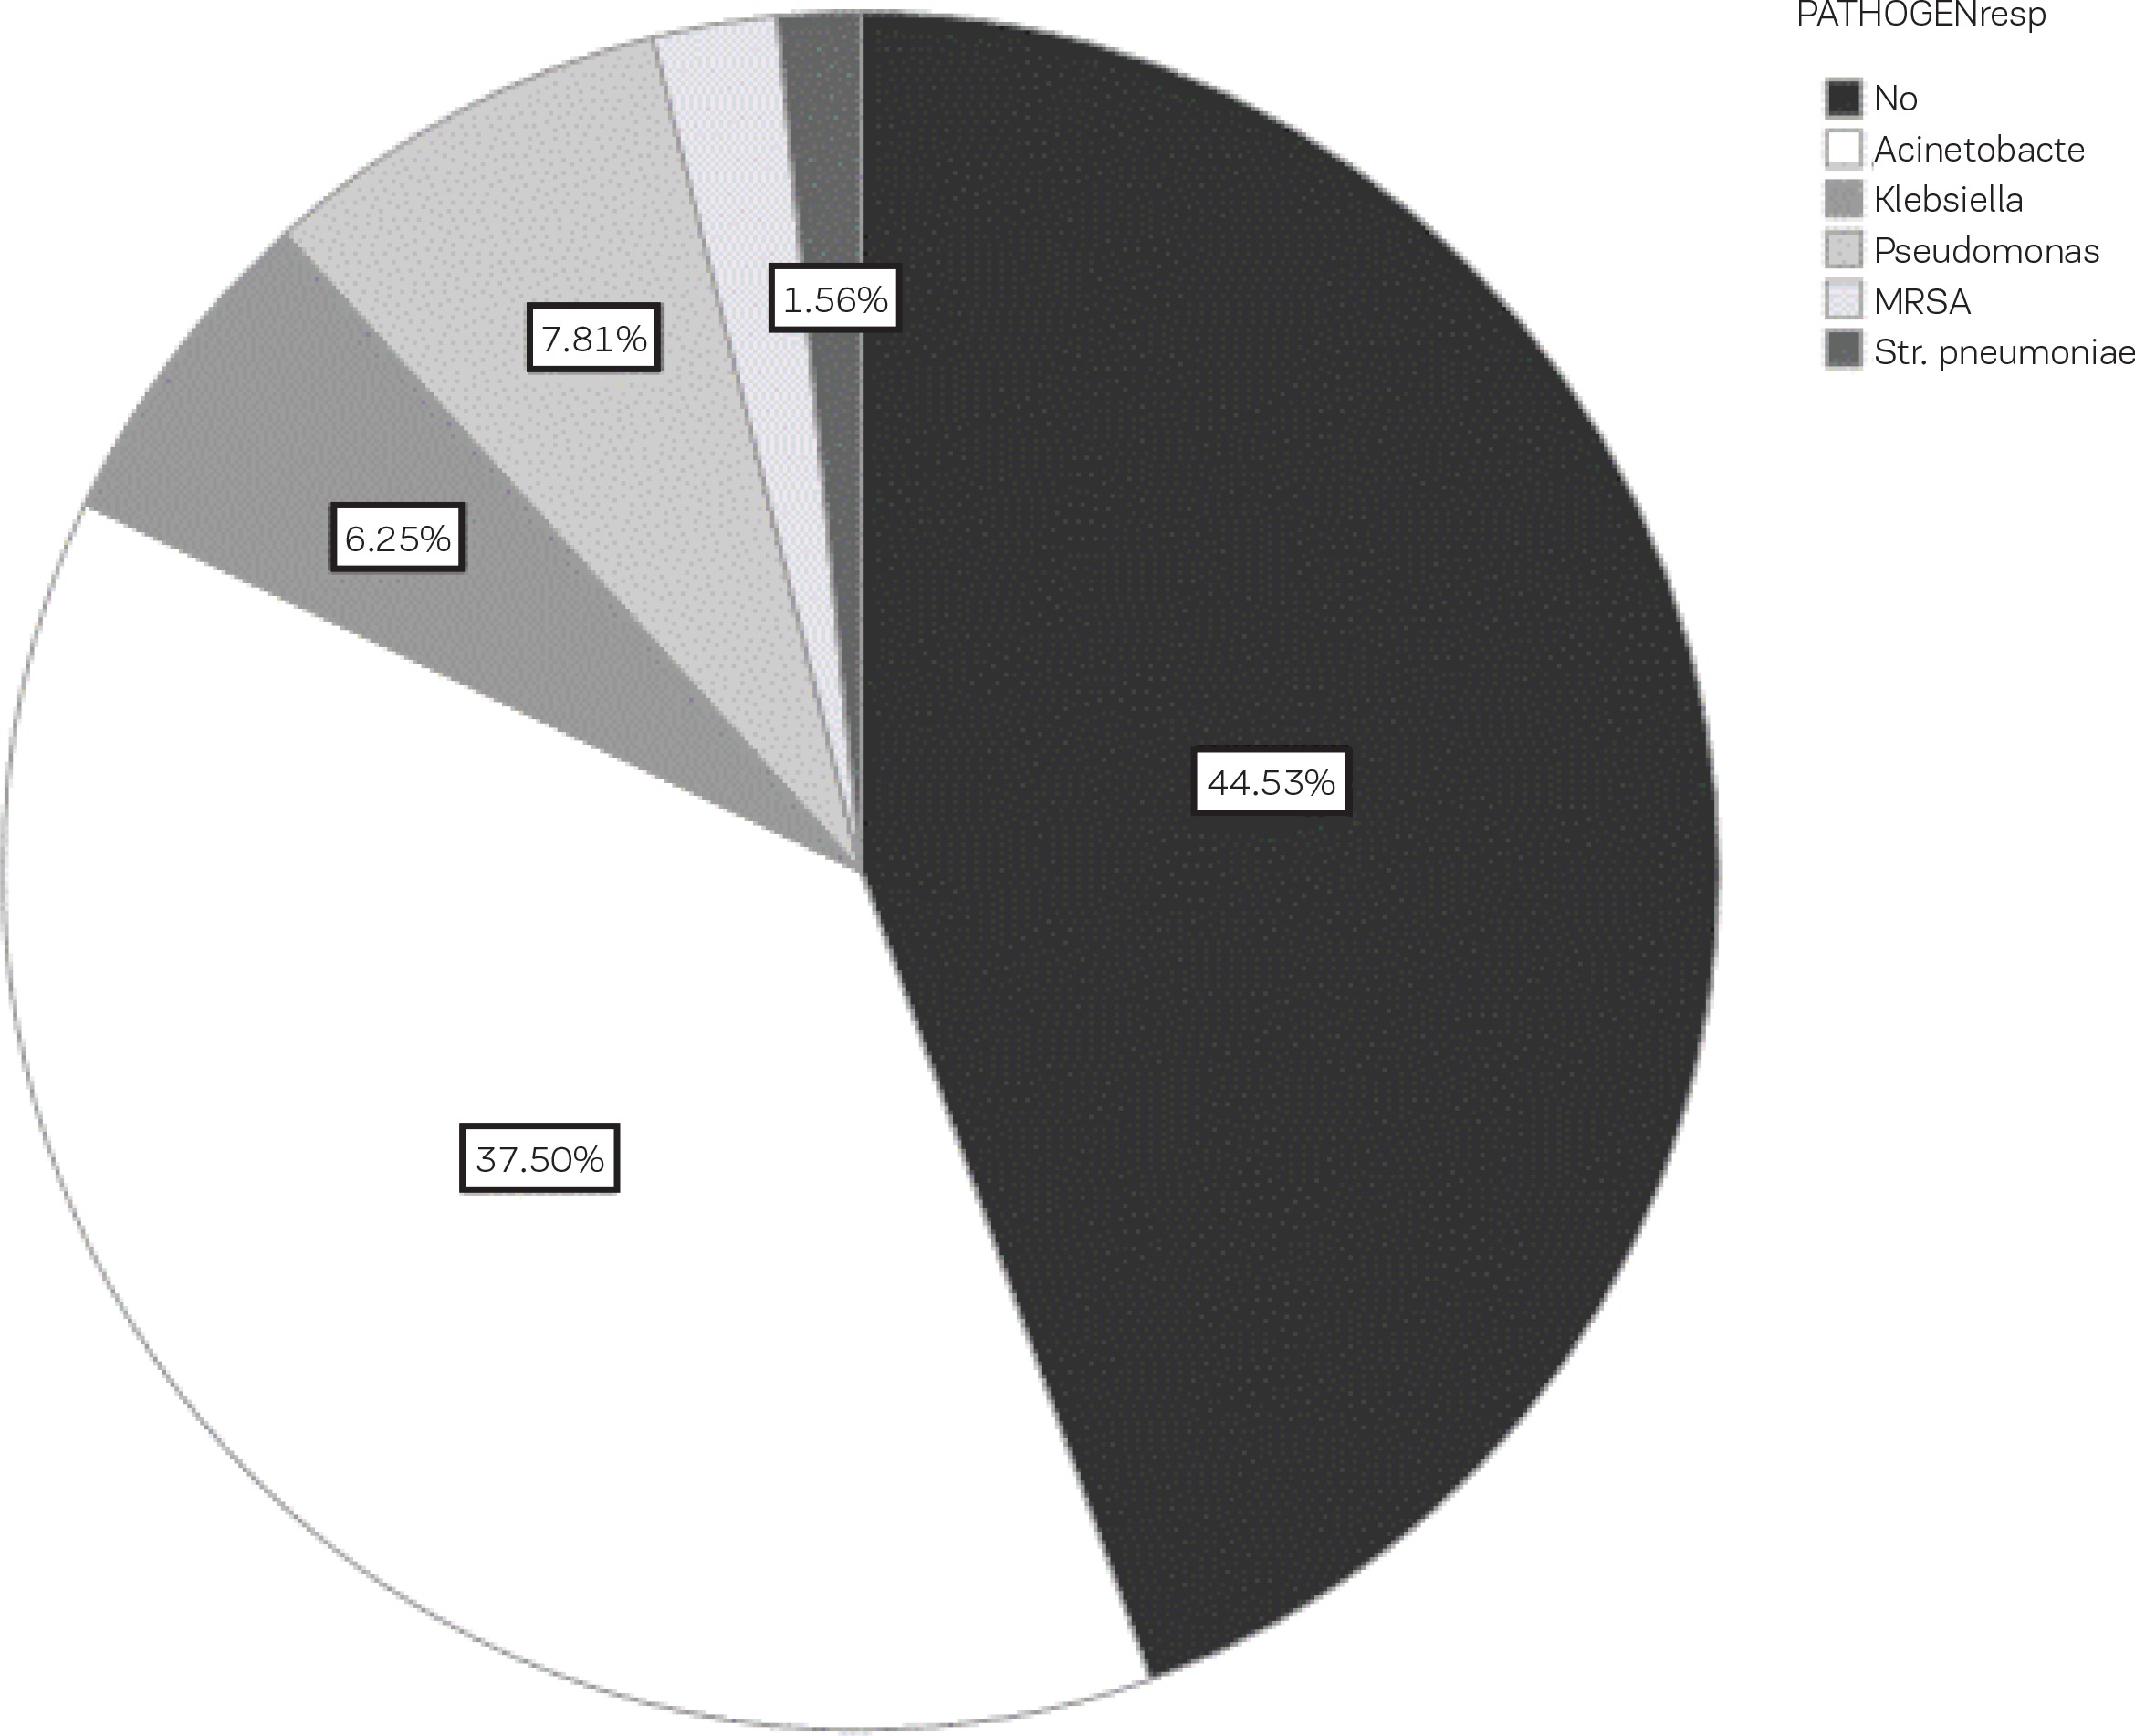
Furthermore, multivariable logistic regression revealed older age (OR=1.13 per year increase, 95% CI: 1.04–1.22, p=0.004), APACHE II score (OR=1.11 per unit increase, 95% CI: 1.04–1.22, p=0.004), CCI (OR=1.79 per unit increase, 95% CI: 1.25–2.55, p=0.001), and lactate levels on admission (OR=2.60 per unit increase, 95% CI: 1.17–5.80, p=0.019) as independent predictors of ICU mortality (Table 4). When adjusted for coronary heart disease, diabetes mellitus and chronic renal failure, COPD severity stage was shown to be a strong independent predictor of ICU mortality (OR=4.57; 95% CI: 1.14–18.22, p=0.032). Noteworthy, the survival time between COPD stages 1–2 and 3–4 significantly differed (mean survival 24 days vs 18.4 days; 95% CI: 15.8–21.1, log-rank p=0.003) (Figure 1). Also, in this analysis, lactate levels prevailed as an important predictor of ICU mortality in stages 3–4, as opposed to stages 1–2 (Figure 2). The commonest pathogens isolated in bronchial aspirates are shown in Figure 3.
Table 4
Multivariable logistic regression for mortality in the ICU (N=127)
DISCUSSION
This is the first study assessing ICU mortality in a sample of patients with AECOPD, where all were on mechanical ventilation upon ICU admission. The 28-day ICU mortality was 35%, with older age, APACHE-II score, CCI, lactate levels and COPD severity being independent predictors of death within the unit. In most cases, the decision to initiate mechanical ventilator support in COPD patients with advanced disease is commonly based on predictions about survival and quality of life17-21. However, previous studies have shown that clinician’s assessment usually fail to predict the outcome of these patients who generally seem to have better reserves than estimated21. In this line, in our cohort, the ICU mortality was found to fall in the lower mortality range reported by other studies in critically ill patients with AECOPD, although all our patients were on mechanical ventilation upon admission in the ICU, had a mean APACHE II score of 25, and were significantly more multi-morbid compared to published data4-6,11,16. Our cohort presented with significantly higher rates of cardiovascular co-morbidities and diabetes mellitus compared to published data. Mortality is reportedly increased in patients with cardiovascular co-morbidities8,9,22 and diabetes melitus9-11,23. In the study of Ongel et al.8, COPD patients that did not survive had cardiovascular comorbidities more frequently than ICU survivors. An almost double prevalence of coronary artery disease and arrhythmia was demonstrated in non-survivors compared to survivors, increasing the mortality 2.9-fold and 2.7-fold, respectively. In the same study, a high rate of MOF was recorded in nonsurviving COPD patients in ICU (75%). The presence of MOF is another factor linked to increased mortality risk. In our study, MOF was associated with significantly worse survival and more rapid deterioration.
In 78% of the patients, lower respiratory infection was the commonest cause of AECOPD. Acinetobacter baumannii, Pseudomonas aeruginosa, and Klebsiella pneumoniae were the commonest pathogens isolated from bronchial aspirates. This finding is in line with previous studies showing the prevalence of Gram-negative bacteria in the sputum samples of patients with severe and very severe COPD during the course of an exacerbation24-26. In the studies of Li et al.24 and Eller et al.25, the isolation of Gram-negative pathogens including A. baumannii, P. aeruginosa, K. pneumoniae and members of the Enterobacteriaceae family were higher in severe and very severe patients.
All patients in this cohort had been intubated in the ward or in the emergency room before ICU admission, and quite a few remained on mechanical ventilation for several hours in the ward until an ICU bed was available. Mechanical ventilation per se has been acknowledged as a hazard for increased ICU mortality, with patients being on mechanical ventilation having a mortality rate ranging between 26–82%3,5,6,11,21,27,28. Our results are close to these of Seneff et al.8 who reported a mortality rate of 24% in a cohort of COPD patients that were intubated on the first day in ICU in almost half the percentage than our patients (47%). Furthermore, in another study8, authors reported an ICU mortality rate of 50% in a cohort of COPD patients, of which 11.7% were intubated upon admission.
Pre-ICU intubation, the severe physiological derangement of the patients upon ICU admission and the high comorbidity burden could justify the comparatively longer LOS in ICU seen in our study compared to other published data (mean APACHE II score: 25; 23% with MOF, 25% in septic shock, lactic acidosis, and 43% with acute renal failure). Moreover, they were patients with a prior severely impaired health status since they were frequent exacerbators (of average three hospitalizations due to exacerbation in the previous year), had a high comorbidity index (mean value of 5.8), with most of the patients suffering from cardiovascular diseases (coronary disease, arrhythmias, and hypertension), while 42.5% were on LTOT. These indices were significantly worse in the non-survivors. There are limited data on the relationship between LOS in the ward before ICU admission and in-hospital or in-ICU mortality6,29. Although we did not find that association in our cohort, other authors have reported that longer duration of ward stay is associated with increased risk of mortality4,10.
APACHE II score has been repeatedly acknowledged as a predictor of mortality in AECOPD patients that are critically ill4,17,22. In a systematic review, using the APACHE II score as a mortality predictor in COPD patients22, patients with APACHE II score of 13 had a mortality of 37%, while in another study APACHE II score of 23.8 was associated with 41% mortality17,29. Our patients had a mean APACHE II score of 25, which was associated with a comparatively low mortality rate of 35%. A plausible explanation could lie on the nature of our ICU which is located in a referral hospital for the diseases of the chest and has a dominant respiratory orientation warranting the timely and experienced handling of these patients.
Notably, non-survivors had a worse pulmonary function with a lower mean FEV1 compared to survivors, suggesting increased severity of COPD and, therefore, a possibly higher probability for adverse outcomes. However, in line with quoted data, FEV1 per se was not associated with ICU mortality in the multivariate analysis3,4,27, although disease severity stage was found to be a strong independent predictor of ICU mortality. In our cohort, pulmonary function testing was available in less than half of the patients included in the analysis (48%). Factors acknowledged by other authors, such as missing data on pulmonary function status, remote pulmonary function assessment that does not reflect the present condition, tests that refer to exacerbation states, or periods close to an exacerbation in the re-evaluation of a patient, pose limits in the validity of this finding.
Limitations
A number of limitations have to be acknowledged in our study. This was a retrospective, single-center review of a cohort of AECOPD patients admitted in the ICU of a respiratory referral hospital, therefore the findings of the study cannot be generalized. Data on well-known predictors of outcome, such as patient pulmonary function status in terms of recent spirometry and their functional status in terms of pre-existing frailty, were not available for collection in a significant percentage of the cohort. Furthermore, although beyond the scope of this study, patients surviving AECOPD in ICU were not followed up to assess re-admission to ICU and short-term mortality rates, long-term survival and quality of life, after the discharge from the ICU.
CONCLUSIONS
Although ventilated critically ill patients with AECOPD showed increased 28-day ICU mortality rates, they exhibited better survival than estimated based on APACHE score and CCI. Parameters impacting the patient’s global health status such as age, disease severity, comorbidities, and APACHE score, and lactate on ICU admission, were found to be strong predictors of ICU mortality. The lack of homogeneity in the pulmonary functional data of the patients and the discrepancies in the handling practices of such patients in the ICUs around the world (who should or should not be intubated, end of life practices), and the lack of data for the long-term survival and quality of life of these patients, pose limitations in determining the predictors that would be useful in decision making on the demand of ICU care.