


INTRODUCTION
Obstructive sleep apnea (OSA) is a common sleep disorder characterized by recurrent upper airway obstructive events, leading to intermittent hypoxemia, cortical arousals, sleep fragmentation, increased inflammation, and oxidative stress1. Phenotyping OSA, besides of improving understanding of disease mechanisms, has prognostic and therapeutic utility2. REM-related OSA is a distinct polysomnographic phenotype with an estimated prevalence ranging from as little as 10% to as much as 45%3,4. This wide range of prevalence could be attributed to inconsistent definitions of REM-related OSA and to differences in studies’ methodology, sample size, and composition3,5.
A broadly used definition requires an overall apnea-hypopnea index (AHI), measured during total sleep time (AHITST), of at least 5 obstructive respiratory events/h (AHITST ≥5) and AHI in REM sleep (AHIREM) that is at least twice the AHI in NREM sleep (AHINREM), (AHIREM/AHINREM ≥2)5-7. Subsequently stricter definitions have emerged, that include various degrees of cut-off levels of AHINREM8-12 or both of AHINREM and AHIREM7,13,14. Furthermore, a minimum duration of REM sleep has been an additional criterion in some of the previous definitions7,12-14. The stricter definitions, include the aforementioned criterion of a sufficient REM sleep duration, aiming to estimate more precisely the REM sleep disordered breathing7,12-14. It is notable that the proposed definition of Mokhlesi and Punjabi13 does not include the AHIREM/AHINREM ratio, since its nominator and denominator are correlated values, and by using their ratio, it could be difficult to separate out the NREM sleep component in REM-related OSA patients13. However, to date, comparative studies failed to demonstrate significant differences in the most of their major endpoints, when stricter and broader definitions were applied and compared at the same sample5,7,15-18. The broader definition, besides the fact that it is easier to apply in daytime practice, it seems that it is not affected by changes in hypopnea scoring rules and as a result its employment augments the conduction of less biased retrospective studies19.
In the current literature, despite the numerous studies conducted in other Caucasian ethnicities, there are no published data about REM-related OSA in the Greek population. In this study, we aim to record demographic, anthropometric and clinical characteristics, polysomnographic findings and comorbidities of REM-related OSA patients, and to evaluate possible differences with non-REM-related OSA patients. Also, we explore possible correlations of excessive daytime sleepiness (EDS) and insomnia, in REM-related OSA and non-REM-related OSA compared groups.
METHODS
Study population
In the present retrospective observational study, a total of 2561 medical files of patients with suspected sleep-related breathing disorders, who underwent polysomnography (PSG) at the Sleep Laboratory of the University General Hospital of Alexandroupolis from 2007 to 2019, were reviewed. A total of 1495 patients had been diagnosed with OSA, and approximately 16% of them (239 patients) were classified as REM-related OSA patients, while the rest (1256 patients) were classified as non-REM-related OSA patients.
The broad REM-related OSA definition was used. According to it, an overall apnea-hypopnea index of at least 5 obstructive respiratory events/h (AHITST ≥5) and AHIREM that is at least twice the AHINREM (AHIREM/AHINREM ≥2) are required. Eventually 147 patients were included from each group and each case (REM-related OSA patient) was matched to one control (non-REM-related OSA patient) by age, gender, and body mass index (BMI).
Ethical approval
All procedures were performed in accordance with the ethical standards of the institutional review board of Alexandroupolis University Hospital, which approved the protocol of the study (approval number:7/07-04-2022).
Data collection
The demographic and anthropometric data that were recorded between two groups include: age, gender, BMI, neck circumference, waist-to-hip ratio (WHR), and tobacco smoking history. Clinical symptoms (snoring, witnessed apneas, EDS, insomnia) and comorbidities (chronic diseases under current treatment or not) were also recorded.
The validated Greek version of the Epworth Sleepiness Scale (ESS) was applied for the assessment of EDS20. ESS score >10 was the cut-off value used to define EDS. Assessment of insomnia was performed with a self-report questionnaire that includes the essential criteria of the International Classification of Sleep Disorders for chronic insomnia. Patients with insomnia were further classified in subtype groups of onset or maintenance insomnia, or combination of the above, according to the documented answers in the previous questionnaire.
Furthermore, Comorbidities Index (CoSA Index) was applied and compared in both groups. This evaluates the mortality risk of sleep apnea patients, based on their comorbidity burden (hypertension, COPD, diabetes mellitus, ischemic stroke, malignancy, heart failure, dementia, atrial fibrillation, end stage renal disease, aortic aneurysm, and age ≥65 years). Points, ranging 1–6, are assigned to each selected comorbidity and they are proportional to its mortality hazard ratio. The final CoSA Index score is stratified in four severity levels (0, 1–3, 4–6, >6) with different crude mortalities (0.57%, 1.71%, 6.79%, 15.88%, respectively)21. Polysomnograms were scored according to the updated for each period AASM criteria, AASM 2007 and AASM 2012, since data are retrospectively analyzed, including archives of patients who were referred for sleep evaluation from 2007 to 2019.
Based on severity grading of OSA, by using the AHI system OSA, subjects with (5≤ AHITST <15), (15≤ AHITST <30) and (AHITST ≥30) were classified as mild, moderate, and severe OSA, respectively.
Besides AHITST, AHIREM and AHINREM, the following polysomnographic measurements were recorded: Total Sleep Time (TST), Sleep Efficiency (SE)(%), Sleep Latency (SL), sleep stages duration presented as percent of TST (N1/TST%, N2/TST%, N3/TST%, REM/TST%), REM Latency, Mean event duration, Average and minimum oxyhemoglobin saturation during sleep (Average SatO2%, Minimum SatO2%), cumulative percentage of time spent at oxyhemoglobin saturation below 90%, presented as percent of total recording time [CT90%/TRT(%)], Oxygen Desaturation Index (ODI), and Arousal Index (ArI).
Statistical analysis
All analyses were carried out using IBM Statistical Package for Social Sciences (SPSS Inc. SPSS Statistics for Windows, Version 17.0. Chicago: SPSS Inc). Throughout the study, categorical variables are described as frequencies and percentages, and chi-squared test was used for their comparison, except for the cases of very small samples where Fisher’s exact test was applied.
Quantitative variables were tested for normality of distribution by the Shapiro-Wilk test. Because distributions of all quantitative variables were skewed, the non-parametric Mann–Whitney test was used for their comparison and they are presented as median and interquartile range (IQR).
Binary logistic regression analysis was used to estimate the association between EDS and insomnia (defined as primary dependent variables) and AHITST, AHIREM, AHINREM, Average SatO2, Minimum SatO2, ODI, ArI, BMI (defined as primary independent variables), in the REM-related OSA and the non-REM-related OSA group. Odds ratios are presented, along with 95% confidence intervals. All comparisons were two-tailed, and a p<0.05 was considered statistically significant.
RESULTS
Patients’ general characteristics
The demographic and anthropometric characteristics of the REM-related OSA and the matched non-REM-related OSA group are presented in Table 1. REM-related OSA participants were predominantly males (57.8%), middle or older aged, with high BMI. Their median neck circumference and waist-to-hip ratio was 42 cm (IQR: 39–44) and 0.82 cm (IQR: 0.76–0.90), respectively, and no significant differences were found compared to the control group. Also, no significant differences were found in both groups regarding their smoking status.
Table 1
Participants’ demographic and anthropometric characteristics
| Characteristics | REM-related OSA (N=147) | non-REM-related OSA (N=147) | p |
|---|---|---|---|
| Gender* | n | n | 1 |
| Male | 85 | 85 | |
| Female | 62 | 62 | |
| Median (IQR) | Median (IQR) | ||
| Age (years)* | 58 (49–64) | 57 (50–65) | 0.891 |
| BMI (kg/m2)* | 33.8 (29.7–38.9) | 33.7 (29.5–38.9) | 0.854 |
| Neck circumference (cm) | 42 (39–44) | 42 (40–44.5) | 0.097 |
| WHR | 0.82 (0.76–0.90) | 0.81 (0.75–0.89) | 0.660 |
| Smoking status | n (%) | n (%) | |
| Non-smoker | 71 (47.5) | 60 (40.8) | 0.197 |
| Current smoker | 37 (25.6) | 43 (29.3) | 0.432 |
| Former smoker | 39 (26.9) | 44 (29.9) | 0.517 |
Polysomnographic characteristics
Table 2 displays the comparison of polysomnographic findings between the REM-related OSA and the non-REM-related OSA group. The two groups were similar in terms of the total sleep time (TST), Sleep Efficiency (SE), Sleep Latency (SL) and the percentage of sleep time spent in N1 stage (p>0.05, respectively). REM-related OSA patients had higher amounts of slow wave sleep (SWS) (p=0.003) and REM sleep (p<0.001), and lower amounts of N2 stage sleep (p=0.001). REM latency was shorter in the REM-related OSA group (p=0.016). Comparison of the nocturnal oximetry findings among the two groups showed that REM-related OSA patients had significantly higher Average SatO2% (p=0.002) and higher Minimum SatO2% (p=0.005), but lower CT90%/TRT(%) (p<0.001) and ODI (p<0.001). Furthermore, REM-related OSA patients had significantly shorter mean duration of respiratory events during TST (p<0.001), and lower ArI (p<0.001).
Table 2
Comparison of polysomnographic characteristics between REM-related OSA and non-REMrelated OSA patients
[i] AHI: apnoea hypopnea index. ArI: arousal index. SatO2: oxyhemoglobin saturation. CT90%: cumulative percentage of time spent at oxyhemoglobin saturation below 90%. EDS: excessive daytime sleepiness. ESS: Epworth Sleepiness Scale. N1: sleep stage 1. N2: sleep stage 2. N3: sleep stage 3. ODI: oxygen desaturation index. OSA: obstructive sleep apnoea. REM: rapid eye movement. SE: sleep efficiency. SL: sleep latency. TRT: total recording time. TST: total sleep time. IQR: interquartile range.
Analysis of respiratory disturbances revealed that REM-related OSA patients had lower AHITST (p<0.001) and AHINREM (p<0.001), while their AHIREM index was significantly higher (p<0.001). These findings were expected, given the criteria of the broad REM-related OSA definition that was applied in our study’s subjects.
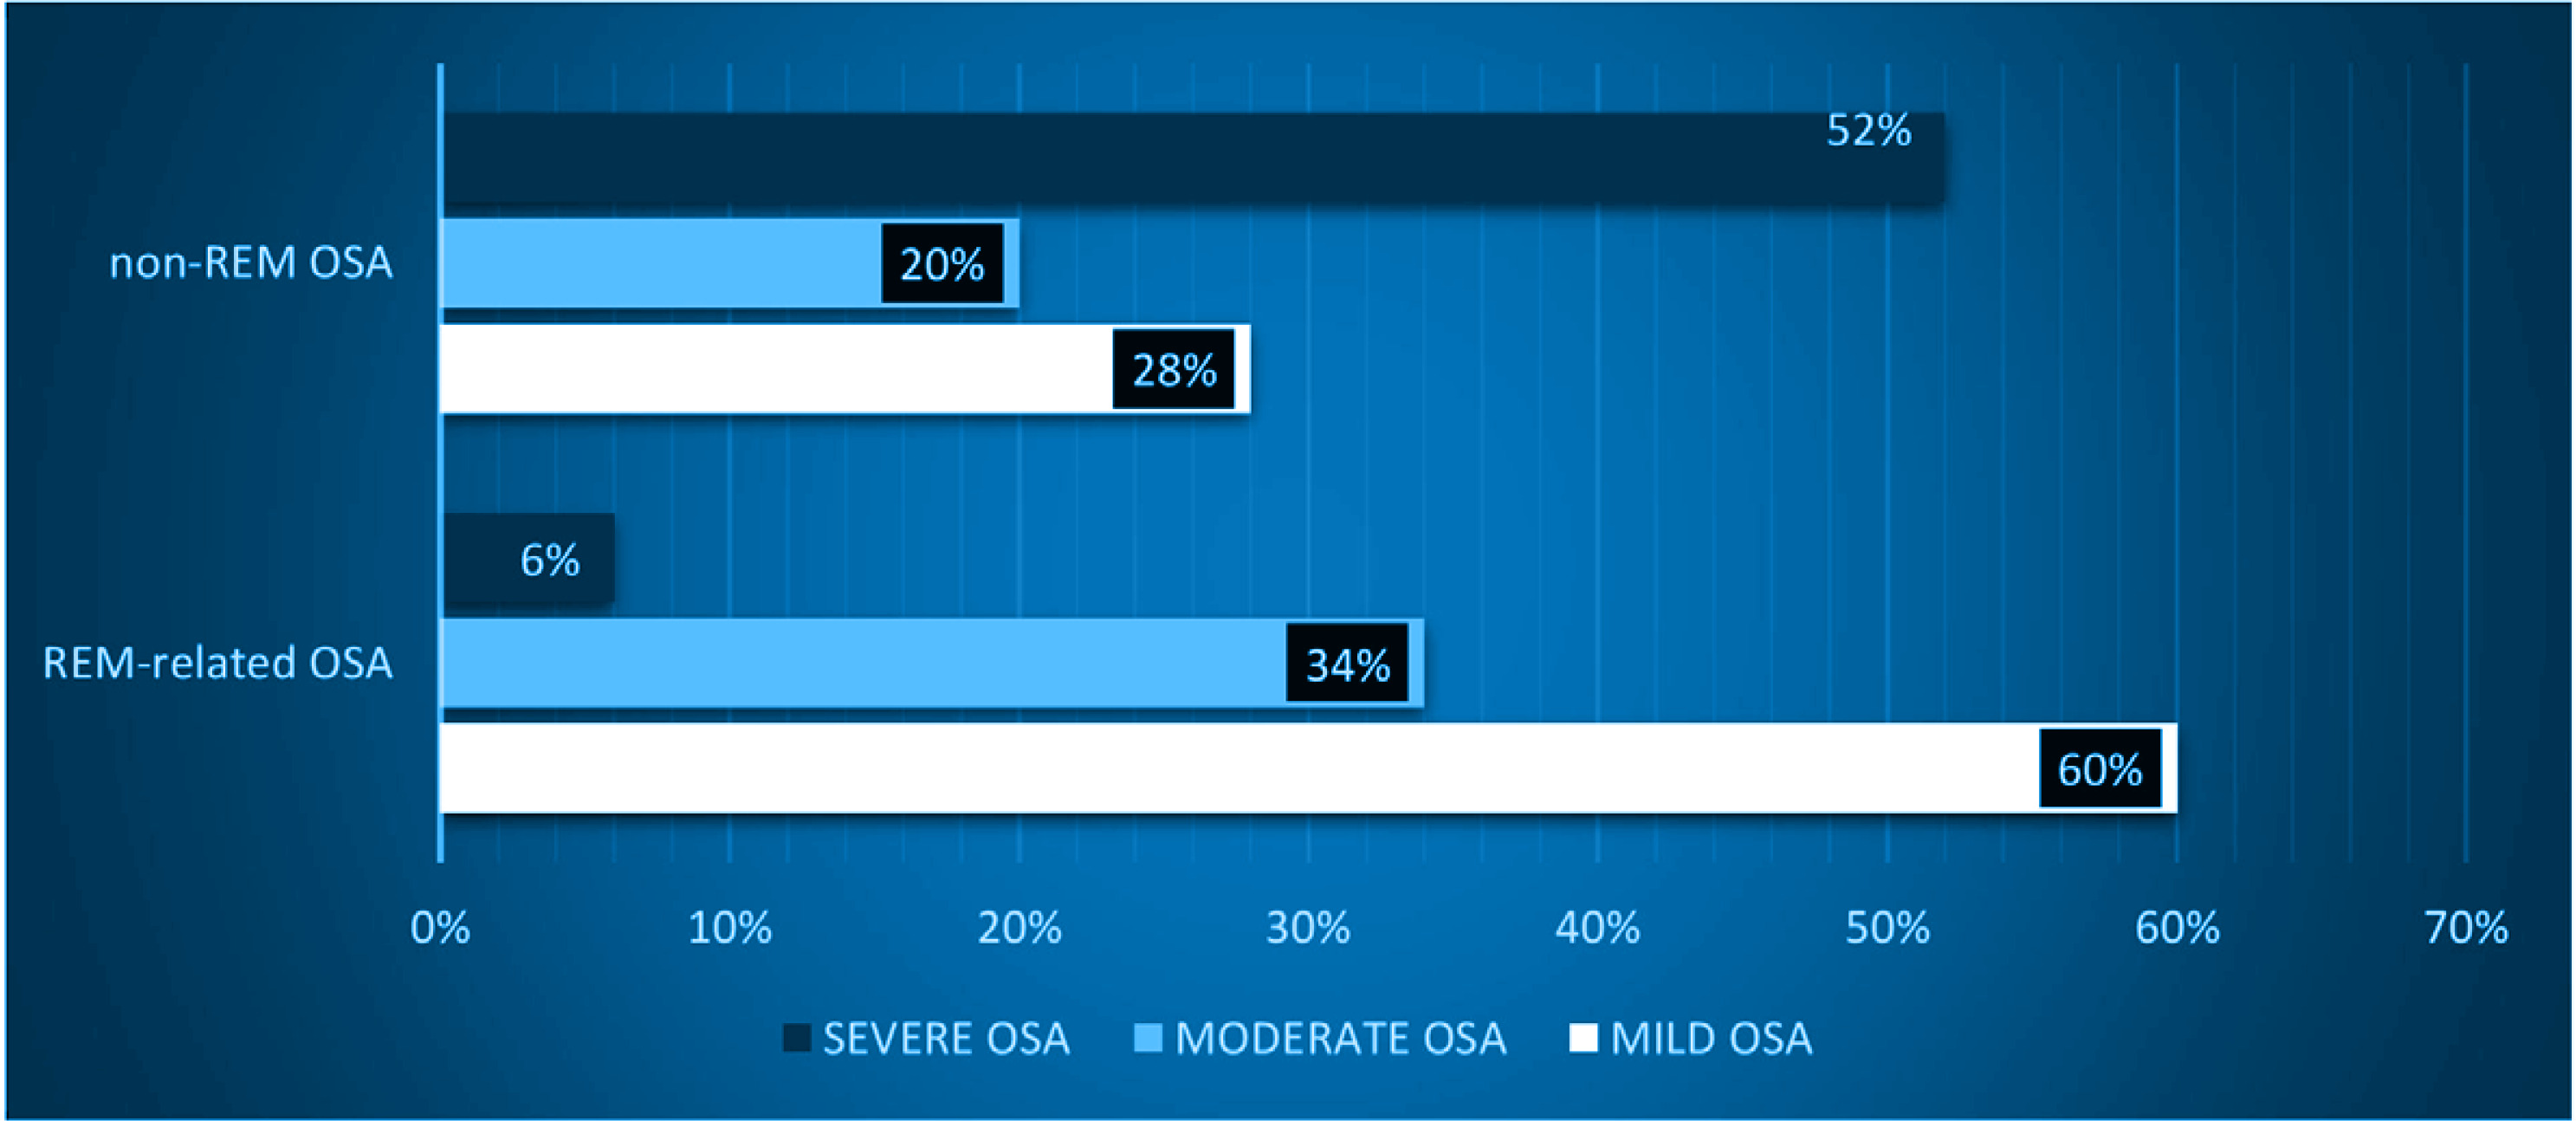
In agreement with the aforementioned data, significant differences have been documented across all OSA severity levels between the two groups. In REM-related OSA patients there is a significant prevalence of mild (p<0.001) or moderate OSA syndrome (p=0.006), compared to the non-REM-related OSA group, while in the latter group, severe OSA is predominant (p<0.001). Indeed, the majority of REM-related OSA patients have mild OSA (about 60%), while 34% have moderate OSA, and only about 6% has severe OSA. In contrast, the majority of the OSA patients suffer from severe OSA (51.7%), while 28.6% and 19.7% have mild and moderate OSA, respectively (Figure 1).
Clinical features and comorbidities
Table 3 shows the frequency of the specific sleep related complaints and the CoSA Index values of both groups, and the results of their comparison. Subjective sleepiness, as evaluated by ESS score, revealed a significant difference between the two groups of patients. REM-related OSA patients had lower ESS score (p<0.001) and lower EDS prevalence (p=0.003). However, there were no significant differences in frequency of habitual snoring, witnessed apneas, chronic insomnia, and insomnia subtypes (p>0.05, respectively).
Table 3
Comparison of clinical characteristics and CoSA Index between REM-related OSA and non-REM-related OSA patients
| Characteristics | REM-related OSA (N=147) n (%) | non-REM-related OSA (N=147) n (%) | p |
|---|---|---|---|
| ESS score, median (IQR) | 7 (4–11) | 9 (7–13) | <0.001 |
| EDS | 45 (30.6) | 69 (47.6) | 0.003 |
| Snoring | 142 (96.6) | 145 (98.6) | 0.251 |
| Witnessed apneas | 83 (56.5) | 74 (50.3) | 0.293 |
| Insomnia | 112 (76.2) | 97 (66) | 0.110 |
| Initial | 7 (6.3)a | 4 (4.1)b | 0.492 |
| Middle | 69 (61.6)a | 60 (61.9)b | 0.971 |
| Late | 1 (0.9)a | 3 (3.1)b | 0.185* |
| Initial/Middle | 32 (28.6)a | 27 (2.8)b | 0.776 |
| Middle/Late | 1 (0.9)a | 3 (3.1)b | 0.339 |
| Initial/Middle/Late | 2 (1.7)a | 0 (0)b | 0.500 |
| CoSA Index, median (IQR) | 2 (0–4) | 2 (0–4) | 0.590 |
| CoSA Index level | |||
| 0 | 59 (40.1) | 45 (30.6) | 0.088 |
| 1–3 | 49 (33.3) | 65 (44.2) | 0.055 |
| 4–6 | 30 (20.4) | 29 (19.7) | 0.884 |
| >6 | 9 (6.1) | 8 (5.4) | 0.803 |
Figures 2 and 3 depict the frequency distribution of insomnia subtypes of both groups. It is clearly observed that the middle insomnia (difficulty in maintaining sleep) and the combination of initial (difficulty in initiating sleep) with middle insomnia are the most frequent subtypes. As regards comorbidities’ load, comparisons across all CoSA Index severity levels showed no significant differences between REM-related OSA and non-REM-related OSA patients.
Comorbidities’ distribution in both groups is illustrated in Figure 4. Arterial hypertension and metabolic diseases, specifically diabetes mellitus and dyslipidemia, are the most frequently reported comorbidities in both groups, followed by hypothyroidism, cardiovascular diseases, e.g. coronary artery disease, ischemic strokes, and chronic respiratory diseases, e.g. COPD, asthma etc.
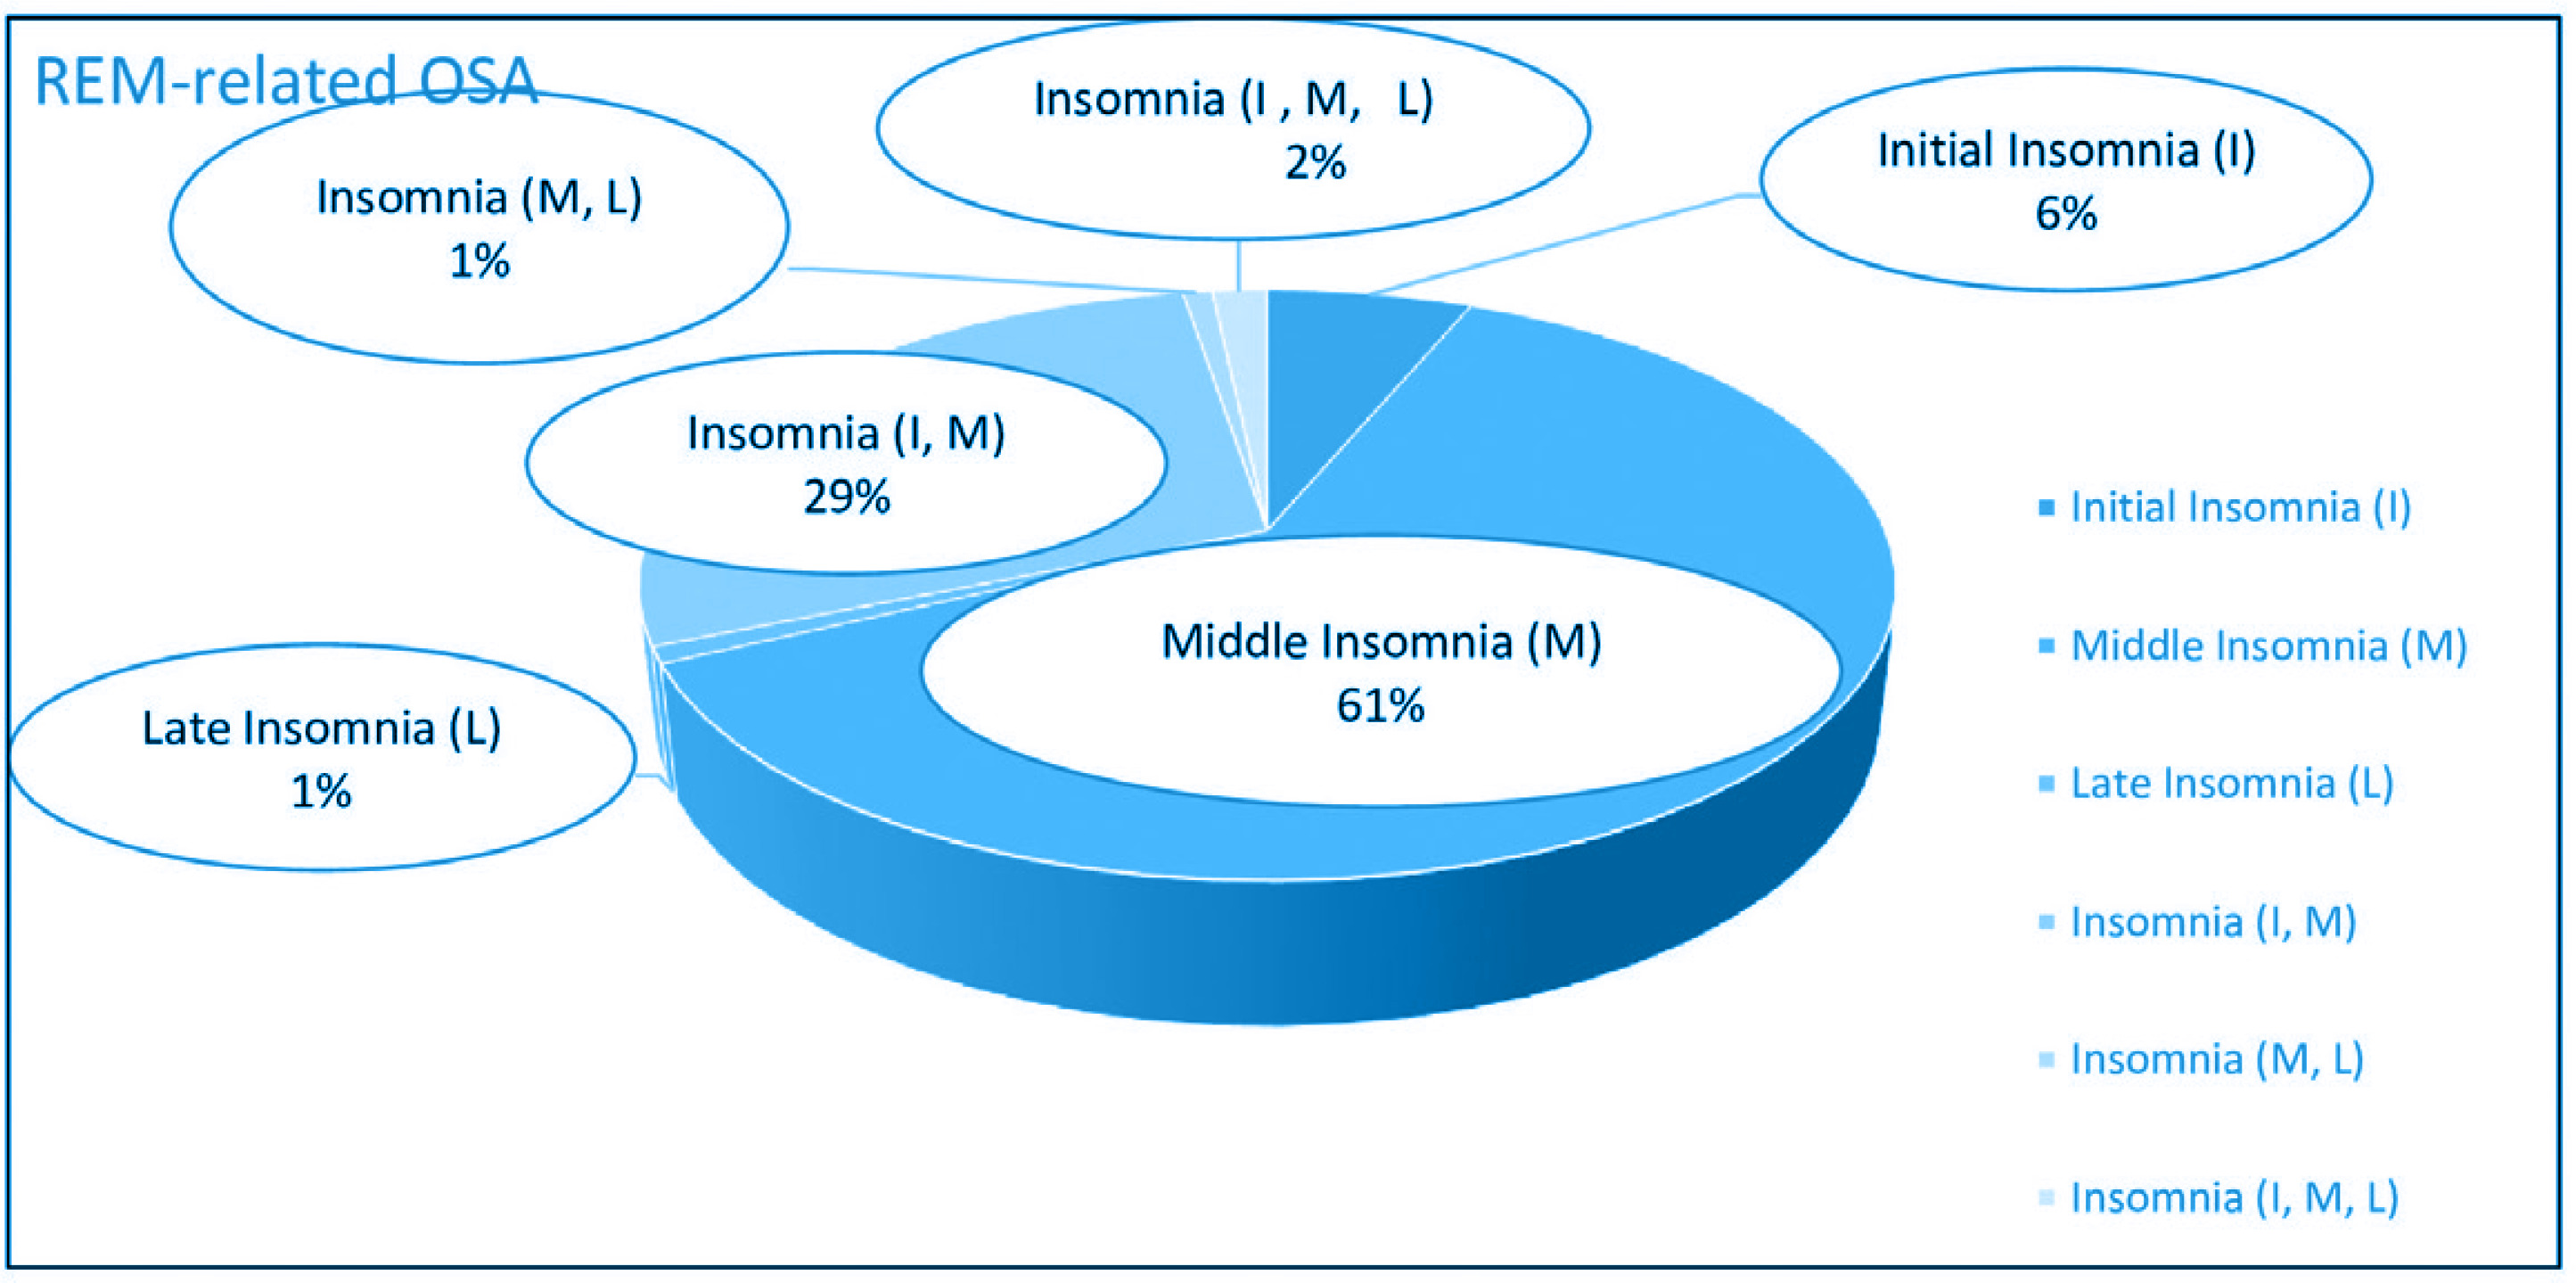
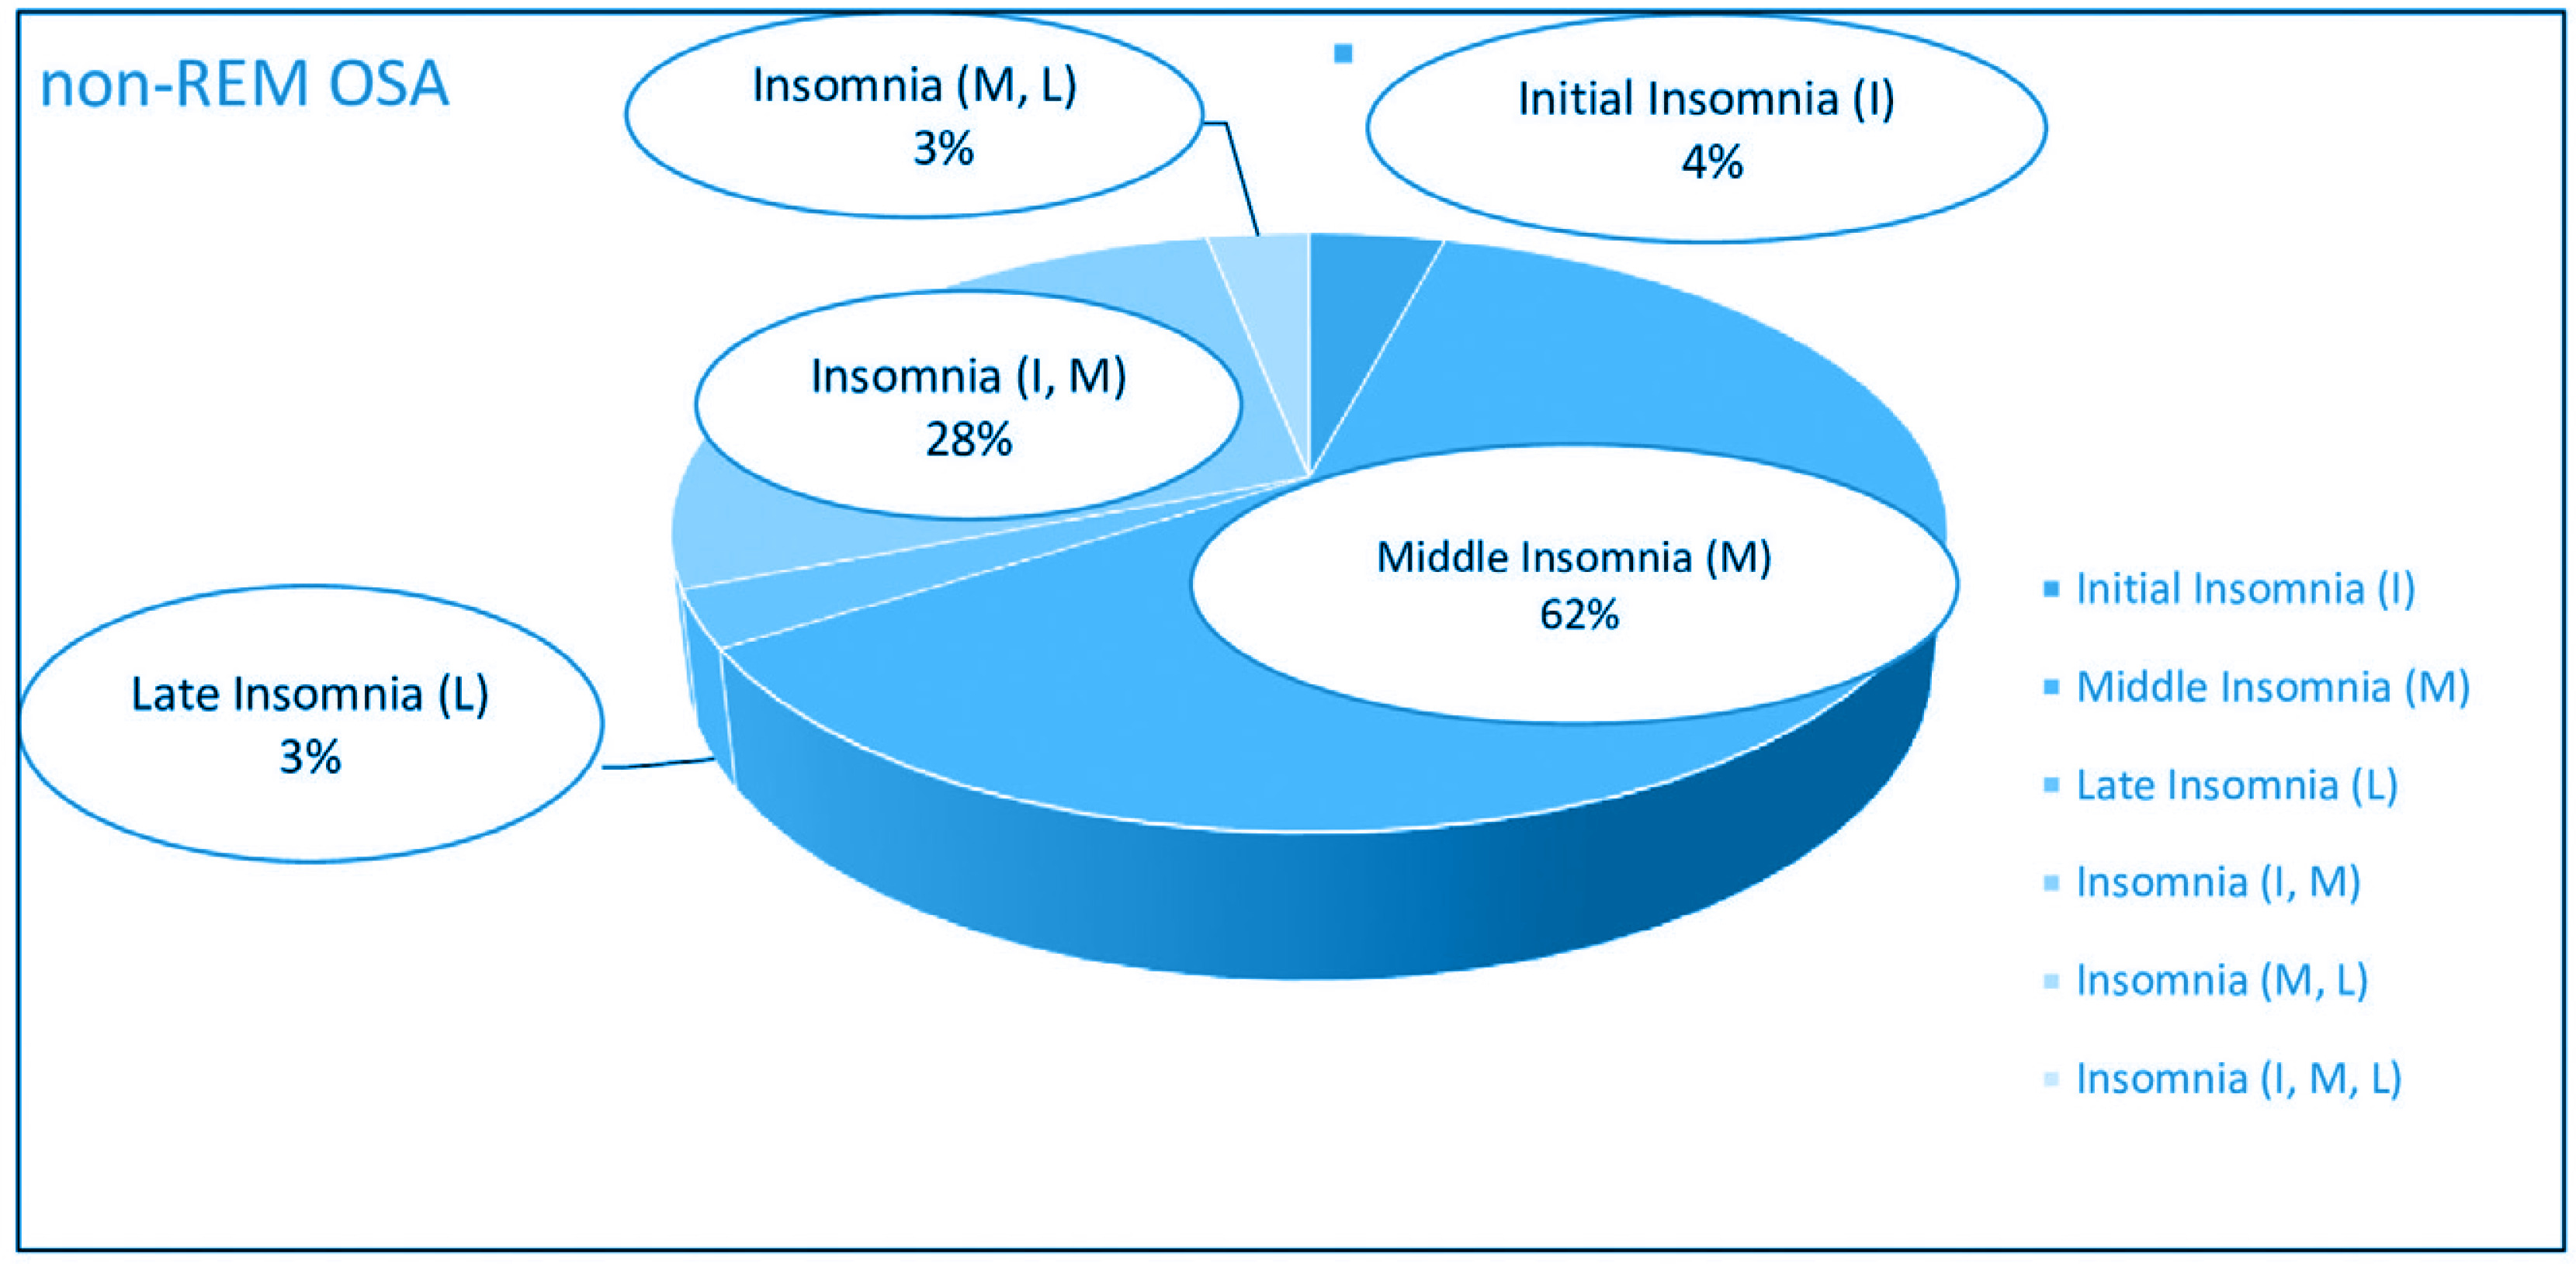
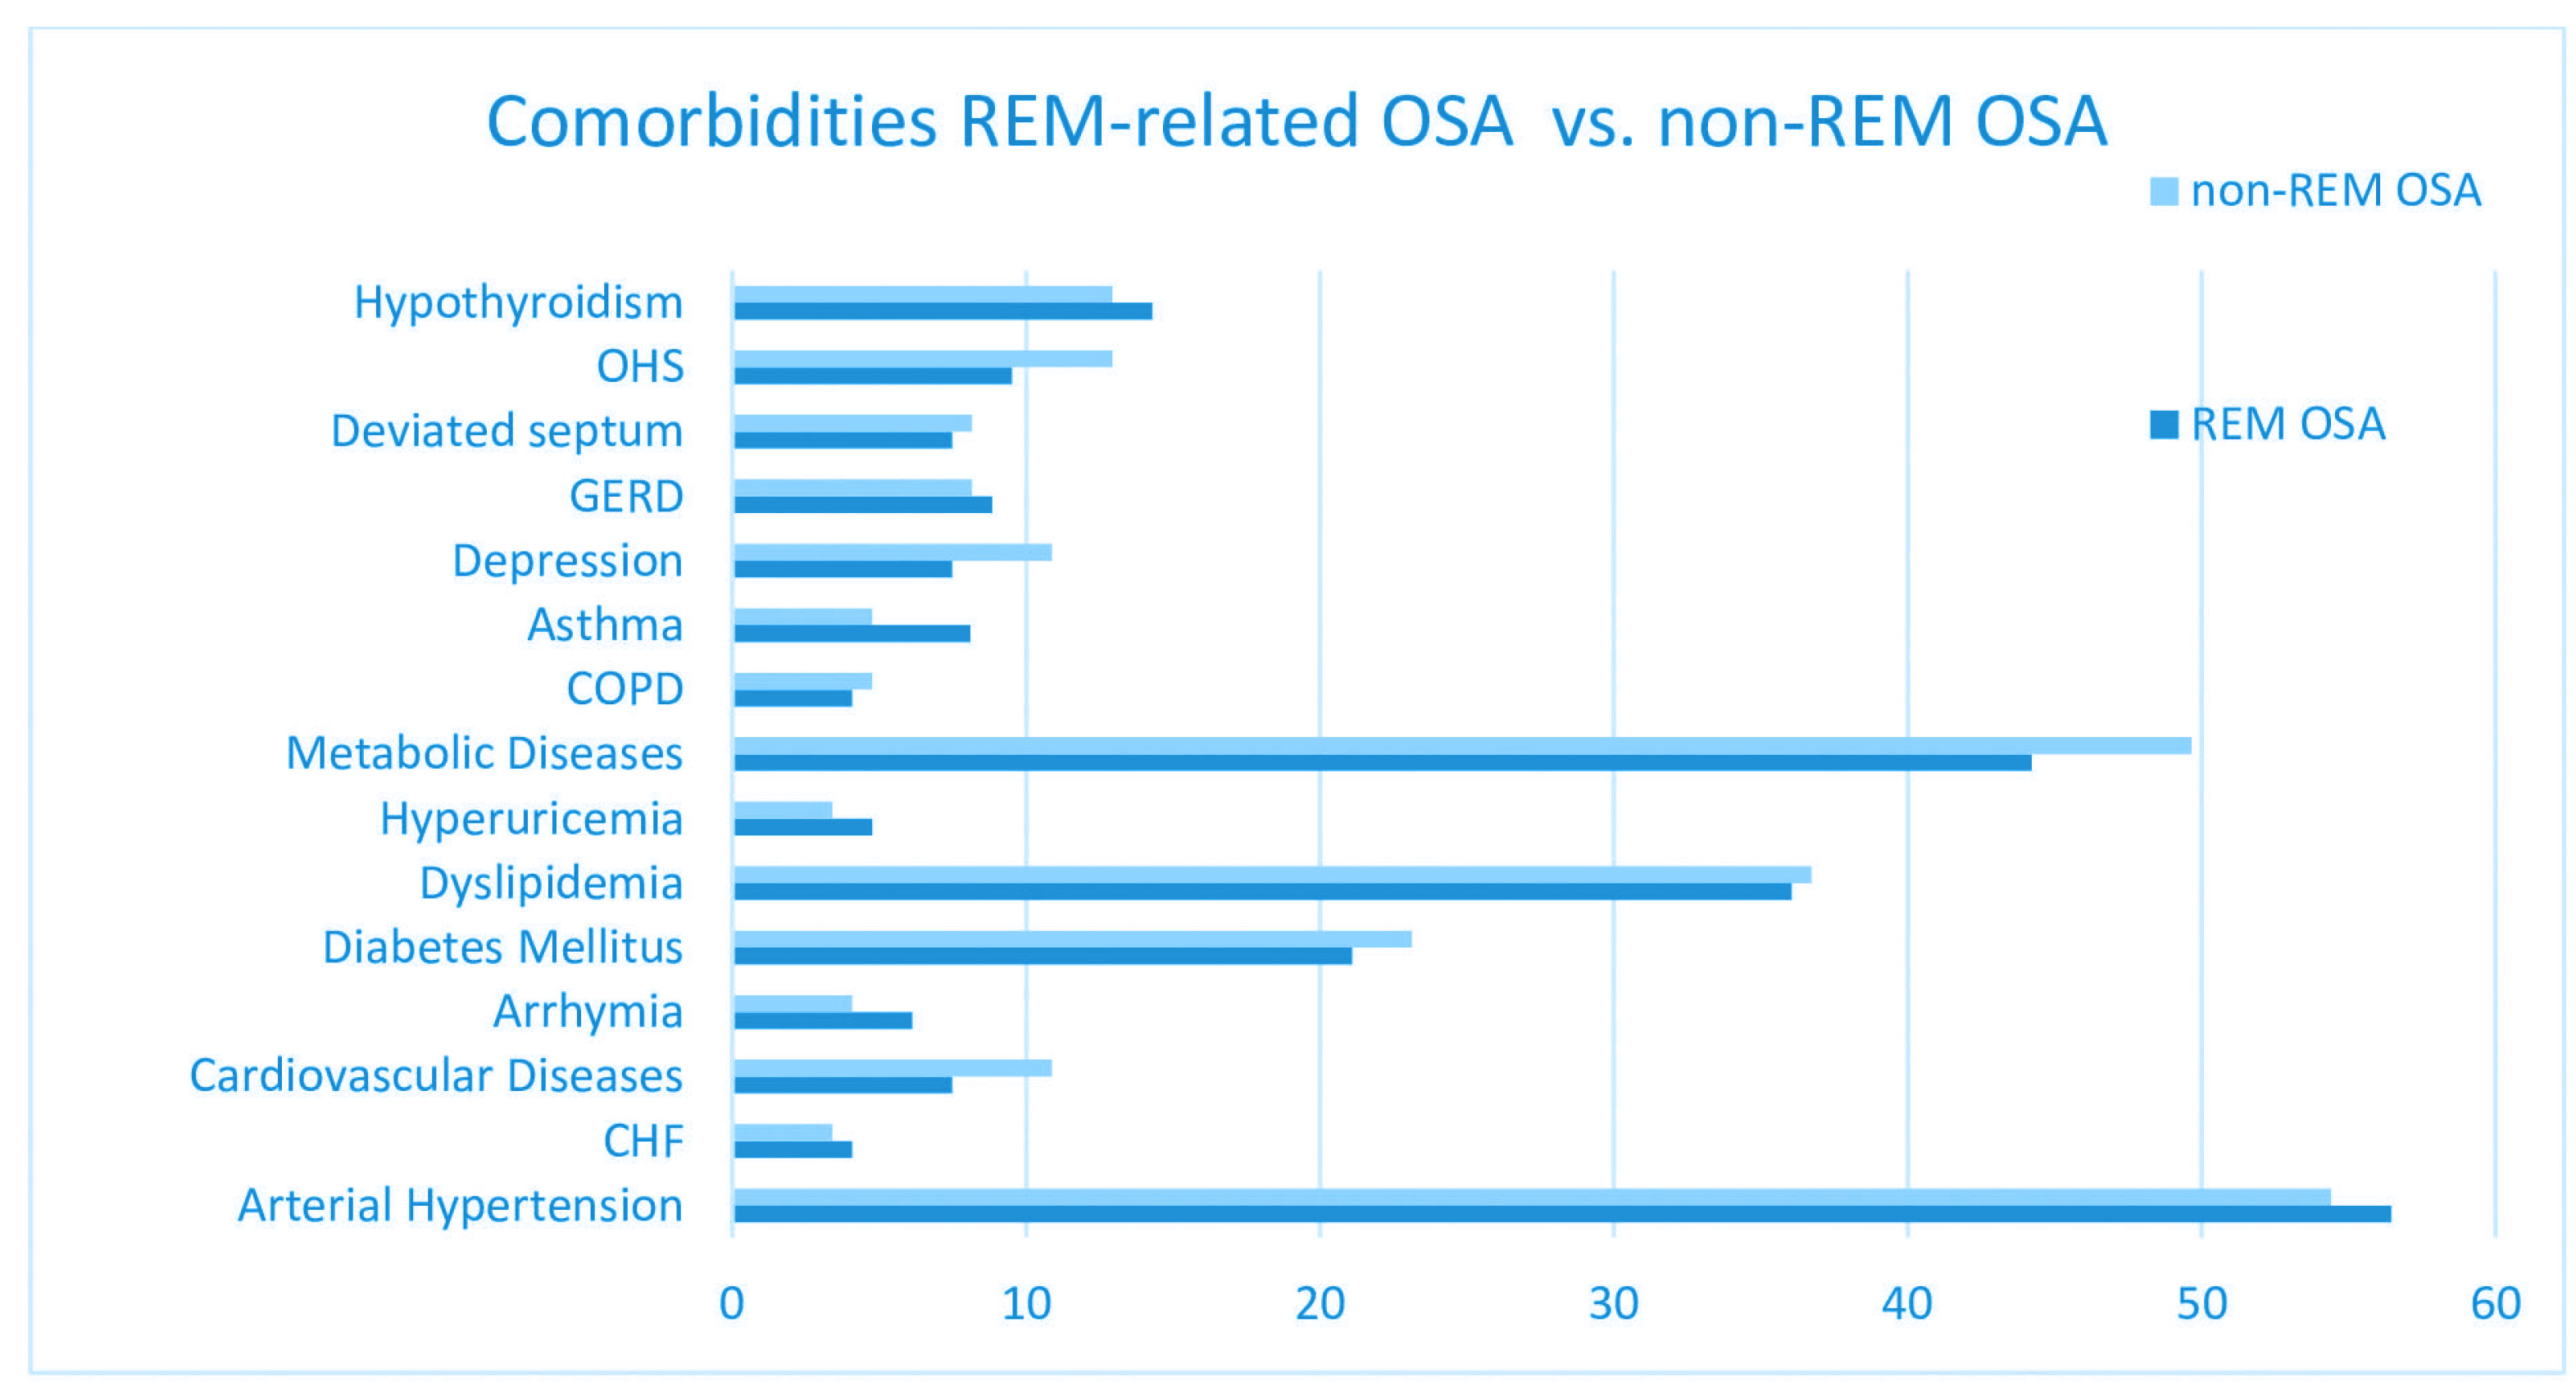
Table 4 shows the frequency of the recorded comorbidities and their comparison between REM-related and non-REM-related OSA patients. No significant differences in comorbidities were noted between the two groups.
Table 4
Comparison of comorbidities between REM-related OSA and non-REM-related OSA patients
Association between polysomnographic parameters and clinical features in REM-related OSA and control group
We analyzed the association of insomnia with polysomnographic findings mainly in REM-related OSA and non-REM-related OSA group, using binary logistic regression model, with insomnia defined as the dependent binary variable. The included independent variables were: ΑΗΙTST, AHIREM, ΑΗΙNREM, Average SatO2%, Minimum SatO2%, ODI, ArI, and BMI. In the REM-related OSA group, a weak positive correlation was found between insomnia and the Minimum SatO2% (β=0.083, p=0.041, RR=1.086; 95% CI: 1.003–1.176), whereas no significant association was found regarding insomnia in non-REM-related OSA patients.
Similarly, we analyzed the association of EDS with the same parameters, separately in the REM-related OSA and non-REM-related OSA group, using the binary logistic regression model, with the EDS defined as the dependent variable. No significant association was found, regarding EDS, in both groups.
DISCUSSION
In this retrospective study, no differences were found regarding the anthropometric characteristics of the compared groups. To our knowledge, two studies have performed anthropometric comparisons among REM-related OSA and non-REM-related OSA subjects and found that they did not differ significantly in terms of age, gender and BMI, simultaneously22,23. The study of Sattaratpaijit et al.23 found that REM-related OSA patients tend to have thinner necks, while the study of Liu et al.22 documented no differences, as we did.
Looking at the polysomnographic features of REM-related OSA patients, the studies either document higher TST16,24,25 and SE12,22,24 or – as our study did – they report no differences in them6,16,26. The current study also showed that REM-related OSA patients had significantly higher amounts of SWS and REM sleep. These results agree with other studies, where time spent in N35,6,12,16,24,27 and in REM sleep5,6,12,15,16,24-26 stage, was significantly higher in REM-related OSA subjects, although there are a few studies that do not report differences in REM sleep duration22,26,27. The possible underestimation of REM sleep duration, due to the first night effect that is encountered in hospital-conducted studies28, as ours, should be reasonably considered when assessing the severity of breathing disorders, confined mainly at this sleep stage, i.e. in the REM-related OSA patients, and even more when deciding to offer or not, treatment to these patients.
SL was not significantly different between our two groups, a finding that is in agreement with the results of the study by Sakao et al.16. In that study, the previous finding did not change when different definitions of REM-related OSA were used16. However, other studies have reported significantly longer15 or shorter22 SL in REM-related OSA patients. Moreover, REM latency had a significantly shorter duration in our study, in agreement with the study of Liu et al.22.
The data about the duration of N1 and N2 sleep stages are limited and inconsistent. Our study did not report significant differences in the duration of N1 stage. On the contrary, according to some studies, REM-related OSA patients have shorter N1 sleep stage6,12,15,16. Regarding the duration of N2 stage in REM-related OSA patients, some studies report longer N2 sleep stage15,16 while our study reported shorter N2 stage. These results are similar to the Bahammam et al.12 and Haba-Rubio et al.6 studies, though there was no statistical significance in the latter study.
REM-related OSA patients had lower ArI in our study, in agreement with the results of other published studies5,7,12,15,16,24,26. More specifically, in the studies of Conwell et al.5 and Hoshino et al.15, this difference was significant, even after the application of the stricter REM-related OSA definition.
The comparison of the nocturnal oximetry data between the two groups showed that REM-related OSA patients presented milder nocturnal hypoxia. Also, the majority of previously published studies reported significant higher Minimum SatO2% values6,7,12,15,22,24 and lower CT90%/TRT (%)7,12,15,24 and ODI6,12,16,24. In contrast to Liu et al.22, our study reported higher Average SatO2%. Two comparative studies6,22 demonstrated shorter mean duration of the obstructive events in REM-related OSA, a finding confirmed by our study.
REM-related OSA patients have lower AHITST values and milder syndrome compared to the non-REM-related OSA patients in all published studies6,12,22,24-27, including ours. Our results indicated that the majority of REM-related OSA patients present more frequently mild or moderate syndrome, while non-REM-related OSA patients present more often severe OSA. These findings are comparable to those recorded by other studies5,7,12,25,27. It has long been suggested that REM-related OSA could be a part in the spectrum of sleep disordered breathing that appears in younger ages, pertains and progresses over time to non-REM-related OSA13. This hypothesis, though not still verified, could offer an explanation for the fact that younger age is an independent, strong correlate of REM-related OSA8,9,12 and for the previously mentioned differences in disease severity among REM-related OSA and non-REM-related OSA.
It is plausible that the kind of REM-related OSA definition could affect the distribution of the recorded events across REM and NREM sleep, as stated in some studies5,15,16. This is clearly observed in the study of Hoshino et al.15 where the majority of the events either clustered in REM sleep or in NREM sleep, when the broad – as ours – or stricter definitions were applied, respectively.
No significant differences were reported between the REM-related OSA and the control group, regarding witnessed apneas and disturbing snoring. Our findings agree with those of Sakao et al.16 and Liu et al.22, who also obtained such information during clinical interview of patients and their bed partners. Other studies describe lower percentages of witnessed apneas6,12 or loud snoring5,12 in REM-related OSA. However, the previous findings should be interpreted cautiously, since the majority of REM-related OSA patients were females and no gender matching has been performed between groups.
In the current study, the prevalence rates of EDS that were reported in REM-related OSA and control group were up to approximately 31% and 48%, respectively. These rates are in agreement with the described percentages of many studies where EDS, measured by ESS score, with range 20–68% in REM-related OSA, and 30–67% in non-REM-related OSA patients5,8,14,16,22,25.
In contrast to already published studies, which use the ESS and do not reveal any significant differences in EDS between REM-related OSA and non-REM-related OSA patients5-7,15,16,22,24-27,29, our study and a recent prospective study of Bahammam et al.12 showed that EDS is less frequently encountered in REM-related OSA patients. It is recognized that many factors can induce EDS in OSA population such male gender, increased age, and BMI30,31. Since such matching is lacking in the majority of published studies, comparing REM-related OSA and non-REM-related OSA patients, it could be difficult to come to safe conclusions about possible EDS differences between them. To our knowledge, only one comparative study22 has matched included subjects by age, gender and BMI simultaneously, as in the present study, and according to it, no differences in EDS were recorded between the two groups of patients. However, it is noteworthy that the REM OSA definition that was used in the previous study has not been used or evaluated in other studies.
In the literature, there are scarce and conflicting data about the association of EDS – quantified by ESS – with OSA severity indices, in REM-related OSA and non-REM-related OSA. No correlation of EDS with either apnea-hypopnea indices (AHITST, AHINREM, AHIREM) or nocturnal oximetry parameters (Average SatO2%, Minimum SatO2%, CT90%/TRT (%), ΟDI) or ArI, was noted in our study. Indeed REM-related OSA patients in our study presented better sleep quality (increased N3, decreased ArI). Similarly, in the study of Gabryelska and Białasiewicz26, no association was found between ESS score and AHI. Additionally, in the study of Khan et al.32 which included old-aged males suffering from REM-related OSA, no association was presented between AHIREM severity levels and ESS score32. Interestingly, the majority of published studies do not reveal any correlation between AHIREM and EDS24,29,33.
However, according to Chami et al.33, AHINREM was associated with EDS, evaluated with ESS, in both REM-related OSA and non-REM-related OSA subjects, while Pamidi et al.24 reported AHINREM association only in non-REM-related OSA patients. Notably, in the last study, a positive correlation between BMI and ESS score was documented in REM-related OSA patients, a finding that was not confirmed by our study.
In our study both groups presented high percentages of reported insomnia (76% and 66%, in REM-related OSA and in non-REM OSA group, respectively). Given the fact that older age, the female sex, the comorbidity of OSA34 and the smoking habit35 are related to higher prevalence of insomnia, high percentages of insomnia are expected in our study, since our participants with OSA were predominantly middle or older aged, females in a considerable proportion (about 42%) of the whole sample, and often smokers (current or former).
Despite the significant differences in the severity of underlying OSA and in the sleep quality between groups, no differences in the perceived insomnia were demonstrated among them. It is possible that the amount of the reported insomnia could be influenced by other factors that were not included and controlled. For instance, given the retrospective characteristics of the current study, patient records about their daily consumption of caffeine or theine, or the consumption of insomnia-related medication or other psychoactive substances, were difficult to find consistently36. Furthermore, even sleep misperception disorders, that are frequently encountered in insomniacs, could be a confounding factor that is also difficult to be identified and adjusted in retrospective studies as ours37.
Very limited data are available on this topic, and mainly Pittsburgh Sleep Quality Index (PSQI) was applied for evaluating insomnia-related sleep disturbances. In the study by Khan et al.32, no association was described between distinct REM-related OSA severity groups and insomnia. On the other hand, according to the study by Hoshino et al.15, REM-related OSA was associated with increased PSQI score and this association was found to be stronger for definitions stricter than ours. More specifically, when the broad definition – used also in our study – was applied, this association was confined in the females only. In a recent study by Bahammam et al.12 who used a stricter REM-related OSA definition, comorbidity insomnia was more common in REM predominant patients, although there was no matching among groups in terms of sex.
Up to now, to our knowledge, no data regarding insomnia subtypes or associations of insomnia with polysomnographic parameters in both groups have been published. According to our findings, middle insomnia, and combination of initial and middle insomnia, are the most frequently reported subtypes. Furthermore, a positive correlation between Minimum SatO2% and insomnia was identified in our study, indicating a possible weak relation between insomnia and mild REM-related OSA syndrome.
Systemic hypertension is the most frequently recorded comorbidity in both groups of our study and no significant difference between them was demonstrated, a finding that was confirmed in other studies too24,27. However, some other studies showed less frequently hypertension in REM-related OSA, but it seems that there was no matching in the recruited subjects for confounding factors such as age and BMI5,12,25.
Several studies6,16,22 reported no differences in the prevalence of cardiovascular diseases, arrhythmias and heart failure, similarly to our study, ever after employing stricter and broader REM-related OSA definitions16. However, according to the prospective study of Bahammam et al.12, REM-related OSA patients had less frequently coronary disease, though there were no differences in compensated heart failure or strokes.
Regarding metabolic diseases and hypothyroidism, a considerable number of studies, including ours, suggest no significant differences between the two groups6,12,22,24, although one study described lower prevalence of diabetes mellitus in REM-related OSA patients5.
Additionally, our study suggests no differences in respiratory diseases, in agreement with other results5,6,16,22 with the exception of one recent study, which describes higher prevalence of bronchial asthma in REM-related OSA group12.
No differences were also found in reported depression among the two groups. Literature findings are variable and conflicting, since some studies that have used the Beck Depression Inventory22 or just the medical history information6, identified no difference in depression rates, whereas two studies that applied the CES-D (Center for Epidemiologic Research Depression Scale) questionnaire found more depression in REM-related OSA group5,24. However, female predominance in REM-related OSA participants in the latter studies, should be underlined.
Moreover, in our study, no differences in comorbidity burden were recorded between the two groups and the majority of patients were clustered in the lower two grades of the CoSA index.
The similar comorbidities rates should be taken into consideration from sleep physicians, when deciding to suggest or not treatment in REM-related OSA patients, even when they are minimally symptomatic, and especially when they carry a notable comorbidity load, as the patients of our study, since therapy must be tailored to individual patient’s needs, not only by controlling their symptoms, but by preventing comorbidities, ameliorating the impact of existing comorbidities, and improving their life expectancy too.
Limitations
The reported results should be interpreted within the limitations of our study. First, this is a single-center retrospective study, with all the biases related to such clinical recruitment and referral recording patterns. Secondly, it has a relatively small sample size of patients, being examined at a tertiary hospital, where usually more symptomatic or complicated patients are admitted, and as a result possible referral biases could not be eliminated. In addition to the abovementioned features, the male preponderance in our study sample, could impair the representativeness of our findings. since female sex is an independent correlate of REM-related OSA7. Furthermore, it must be stated that clinical assessment was subjective, based mainly on medical history, obtained during clinical interview of patients and of their bed-partners when this was feasible. In particular, the questionnaire that was used for the evaluation of insomnia and its subclassifications, though updated, was not validated. According to the ICSD-3 Classification38, a minimum frequency of 3 times per week was added to diagnostic criteria of chronic insomnia. This additional criterion, established since 2014, was a confounding factor that we could not eliminate, given the retrospective characteristics of our study.
CONCLUSIONS
According to the polysomnographic features of the patients in both groups, we conclude that the REM-related OSA patients have more often mild to moderate OSA and demonstrate a better nocturnal oximetry profile with less sleep fragmentation, in comparison to the non-REM-related OSA patients. No differences were reported regarding anthropometric characteristics (neck circumference, waist-to-hip ratio), the majority of the compared clinical features (witnessed apneas, snoring, and insomnia) and comorbidities. However, REM-related OSA patients reported less frequently EDS, as measured by ESS score. Furthermore, a positive correlation was found between insomnia and Minimum SatO2% in the REM-related OSA group. Despite their differences in polysomnography, REM-related OSA patients do not report overall milder symptoms and do not carry a lighter comorbidity burden, which may imply that they possibly do not comprise a milder, distinct clinical phenotype. More extended and prospective studies have to be conducted in order to draw definite conclusions about the impact of REM-related OSA to quality and expectancy of living, and the possible beneficial effect of implementing treatment modalities to all REM-related OSA patients.